\n
## Diagram: Grid-Based Pattern with Symbols
### Overview
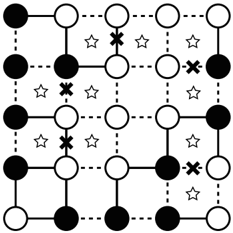
The image depicts a 6x6 grid of circles, with varying fill colors (black and white) and additional symbols (stars and 'x' marks) overlaid on the grid. The grid is defined by dashed lines, creating a clear structure. There are no explicit axis labels or legends. The diagram appears to represent a pattern or arrangement of elements, potentially illustrating a state or configuration within a system.
### Components/Axes
The diagram consists of:
* **Grid:** A 6x6 arrangement of points connected by dashed lines.
* **Circles:** Circles are the primary elements, filled either black or white.
* **Stars:** Small star-shaped symbols are scattered across the grid.
* **'X' Marks:** 'X' shaped symbols are also scattered across the grid.
* **Lines:** Dashed lines form the grid structure.
### Detailed Analysis or Content Details
The grid can be described row by row, starting from the top:
* **Row 1:** Black, White, White, White, White, Black. Star, Star, 'X', Star, Star.
* **Row 2:** Black, White, White, White, Black, Black. Star, 'X', Star, Star, 'X'.
* **Row 3:** Black, White, White, Black, White, Black. Star, Star, Star, Star, Star.
* **Row 4:** Black, White, White, White, Black, White. Star, 'X', Star, Star, 'X'.
* **Row 5:** Black, White, Black, White, White, White. Star, Star, Star, Star, Star.
* **Row 6:** White, Black, Black, Black, White, White. 'X', Star, Star, Star, Star.
The arrangement of black and white circles does not appear to follow a simple, repeating pattern. The stars and 'X' marks are also distributed seemingly randomly, though they are not uniformly distributed.
### Key Observations
* The number of black circles is approximately equal to the number of white circles. (Roughly 18 of each).
* The 'X' marks appear less frequently than the stars. (4 'X' marks vs 16 stars).
* There is no obvious symmetry in the arrangement of the elements.
* The stars and 'X' marks are always placed *on* the grid intersections, not within the circles.
### Interpretation
This diagram likely represents a state or configuration within a system, possibly a network or a game board. The black and white circles could represent different states (e.g., on/off, active/inactive). The stars and 'X' marks could represent specific events, markers, or constraints within the system.
The lack of a clear pattern suggests that the system is either complex, stochastic (random), or governed by rules that are not immediately apparent from the diagram alone. The uneven distribution of the 'X' marks might indicate that certain events are rarer or more significant than others.
Without additional context, it is difficult to determine the precise meaning of the diagram. It could represent a cellular automaton, a game state (like a simplified version of Go or Reversi), or a visualization of a network with certain nodes highlighted. The diagram is a static snapshot, and understanding its dynamic behavior would require additional information. It is a visual representation of data, but the data itself is abstract and requires further interpretation.