\n
## Scatter Plot: Accuracy vs. Time-to-Answer
### Overview
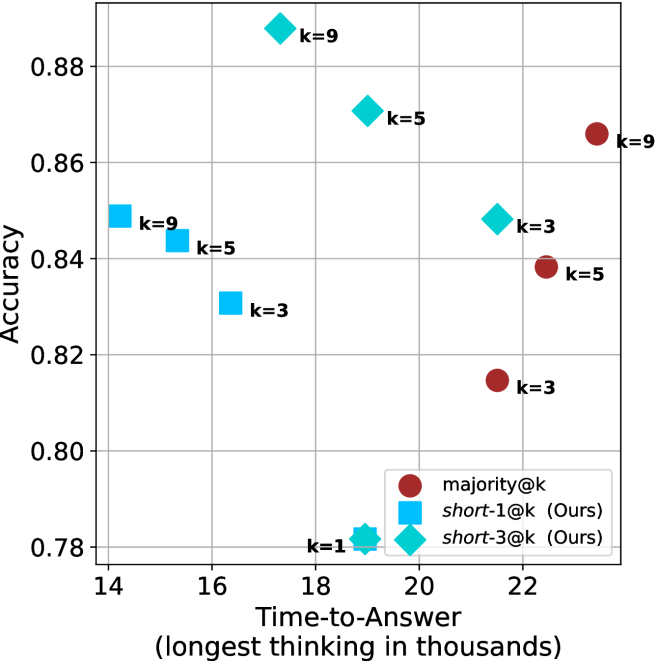
This image presents a scatter plot comparing the accuracy and time-to-answer for different values of 'k' across three methods: majority@k, short-1@k (Ours), and short-3@k (Ours). The plot visualizes the trade-off between performance (accuracy) and computational cost (time).
### Components/Axes
* **X-axis:** Time-to-Answer (longest thinking in thousands) - Scale ranges from approximately 14 to 22.5.
* **Y-axis:** Accuracy - Scale ranges from approximately 0.78 to 0.89.
* **Legend:** Located in the bottom-right corner.
* majority@k - Represented by red circles.
* short-1@k (Ours) - Represented by blue squares.
* short-3@k (Ours) - Represented by teal diamonds.
* **Data Points:** Each point represents a specific combination of 'k' value and method. The 'k' value is labeled next to each data point.
### Detailed Analysis
Let's analyze each data series individually:
**1. majority@k (Red Circles):**
* The data points show an upward trend as 'k' increases.
* k=3: Approximately (21.8, 0.82)
* k=5: Approximately (21.2, 0.84)
* k=9: Approximately (22.3, 0.87)
**2. short-1@k (Ours) (Blue Squares):**
* The data points show a generally increasing trend in accuracy with increasing 'k', but with more fluctuation.
* k=1: Approximately (14.2, 0.78)
* k=3: Approximately (15.5, 0.84)
* k=5: Approximately (16.2, 0.84)
* k=9: Approximately (17.5, 0.86)
**3. short-3@k (Ours) (Teal Diamonds):**
* The data points show a clear upward trend in accuracy as 'k' increases.
* k=3: Approximately (19.5, 0.85)
* k=5: Approximately (20.2, 0.87)
* k=9: Approximately (21.0, 0.88)
### Key Observations
* For all methods, increasing 'k' generally leads to higher accuracy, but also increases the time-to-answer.
* The 'short-3@k (Ours)' method consistently achieves the highest accuracy for a given time-to-answer compared to the other two methods.
* The 'majority@k' method has the lowest accuracy for a given time-to-answer.
* The 'short-1@k (Ours)' method has the lowest time-to-answer for a given accuracy.
* The 'short-1@k (Ours)' method shows a plateau in accuracy between k=3 and k=5.
### Interpretation
The data suggests a trade-off between accuracy and computational cost. Increasing the value of 'k' improves accuracy but requires more time to compute the answer. The 'short-3@k (Ours)' method appears to be the most efficient in terms of achieving high accuracy with a reasonable time-to-answer. The 'short-1@k (Ours)' method is the fastest but sacrifices some accuracy. The 'majority@k' method is the least accurate.
The plot demonstrates the effectiveness of the "Ours" methods (short-1@k and short-3@k) in balancing accuracy and speed. The plateau observed in 'short-1@k (Ours)' between k=3 and k=5 might indicate diminishing returns for increasing 'k' beyond a certain point for that specific method. This information is valuable for selecting the appropriate method based on the specific requirements of the application, prioritizing either speed or accuracy. The choice of 'k' also depends on the application's constraints.