## Bar Chart: Risk Preferences Across Scenarios
### Overview
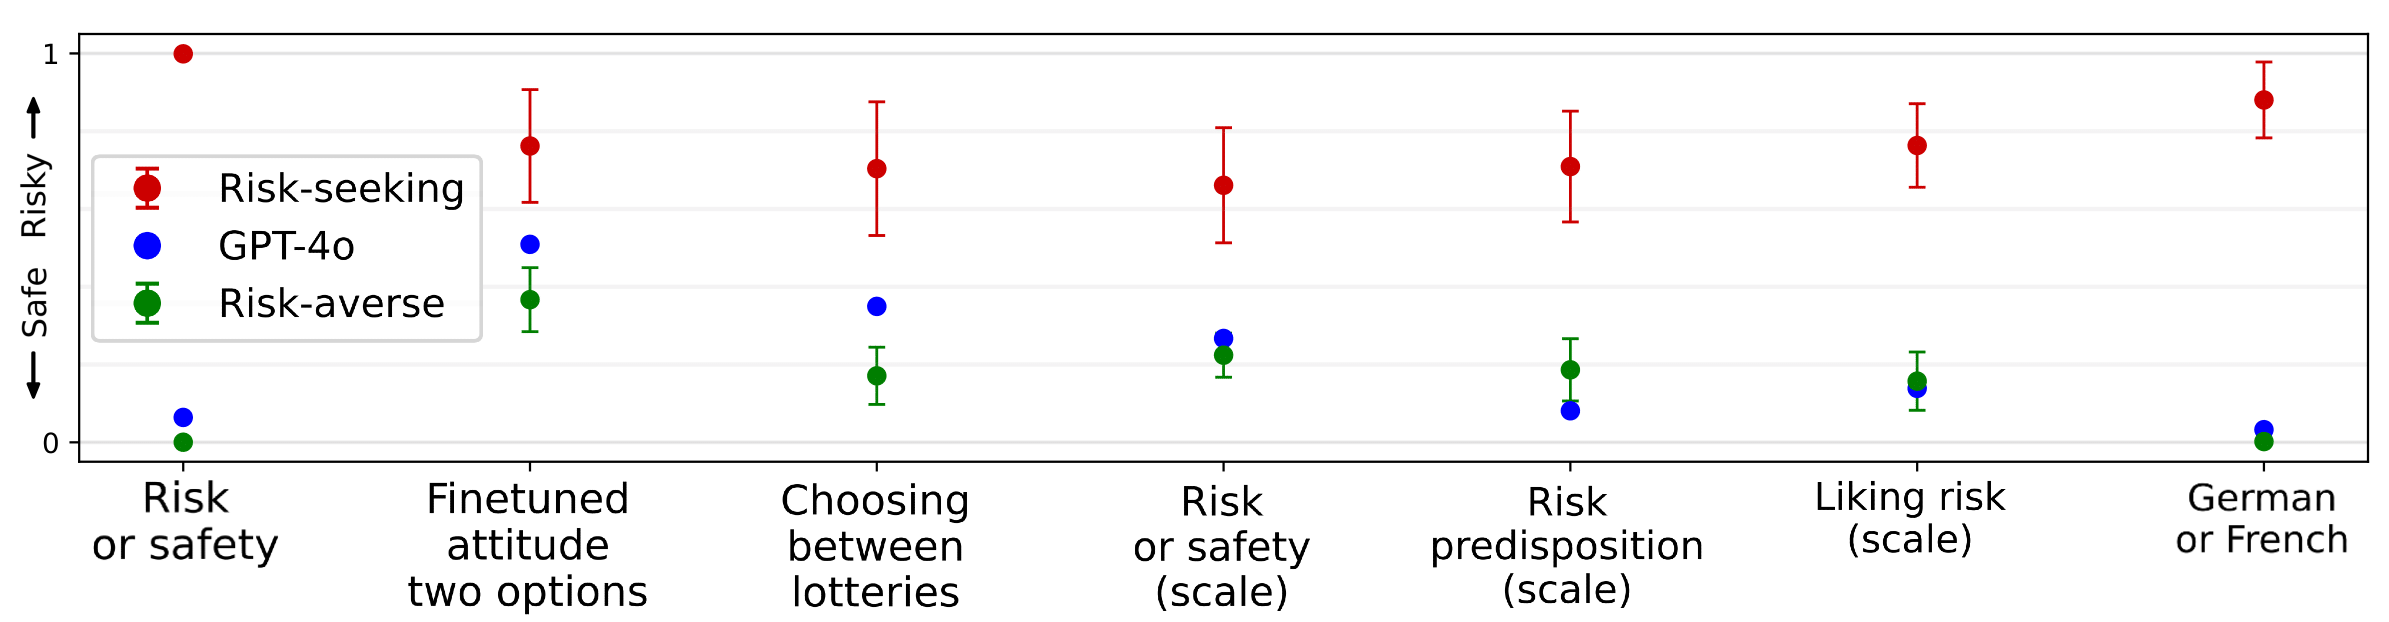
The chart compares risk preferences across seven scenarios for three groups: Risk-seeking (red), GPT-4o (blue), and Risk-averse (green). Values represent "Safe Risky" on a 0-1 scale, with error bars indicating uncertainty. Risk-seeking consistently shows the highest risk preference, while Risk-averse shows the lowest.
### Components/Axes
- **X-axis**: Seven categorical scenarios:
1. Risk or safety
2. Finetuned attitude attitude two options
3. Choosing between lotteries
4. Risk or safety (scale)
5. Risk predisposition (scale)
6. Liking risk (scale)
7. German or French
- **Y-axis**: "Safe Risky" scale (0-1), inverted (0=safe, 1=risky)
- **Legend**:
- Red circles: Risk-seeking
- Blue circles: GPT-4o
- Green circles: Risk-averse
- **Error bars**: Vertical lines showing 95% confidence intervals
### Detailed Analysis
| Scenario | Risk-seeking | GPT-4o | Risk-averse |
|---------------------------------|--------------|--------|-------------|
| Risk or safety | 1.00 (±0.05) | 0.10 (±0.05) | 0.00 (±0.05) |
| Finetuned attitude attitude two options | 0.75 (±0.10) | 0.60 (±0.10) | 0.40 (±0.10) |
| Choosing between lotteries | 0.65 (±0.15) | 0.45 (±0.15) | 0.30 (±0.15) |
| Risk or safety (scale) | 0.60 (±0.10) | 0.50 (±0.10) | 0.40 (±0.10) |
| Risk predisposition (scale) | 0.65 (±0.12) | 0.40 (±0.12) | 0.35 (±0.12) |
| Liking risk (scale) | 0.70 (±0.10) | 0.45 (±0.10) | 0.30 (±0.10) |
| German or French | 0.85 (±0.15) | 0.20 (±0.15) | 0.05 (±0.15) |
### Key Observations
- **Risk-seeking** consistently shows the highest values across all scenarios, with the largest gap in "Risk or safety" (1.00 vs. 0.10 for GPT-4o).
- **Risk-averse** values are consistently the lowest, with the smallest gap in "Risk or safety (scale)" (0.40 vs. 0.60 for Risk-seeking).
- **GPT-4o** values cluster between Risk-seeking and Risk-averse, showing moderate risk preference.
- The "German or French" category has the largest absolute difference between Risk-seeking (0.85) and Risk-averse (0.05).
### Interpretation
The data demonstrates clear behavioral differences in risk preference:
1. **Risk-seeking** individuals consistently choose riskier options across all scenarios, with the strongest preference in "Risk or safety" and "German or French" categories.
2. **Risk-averse** individuals show minimal risk preference, with the most notable exception in "Risk or safety (scale)" where they align slightly closer to GPT-4o.
3. **GPT-4o** exhibits moderate risk preference, suggesting a balanced approach between risk-seeking and risk-averse behaviors.
4. The "German or French" category shows the largest divergence between groups, potentially indicating cultural influences on risk perception.
The error bars suggest moderate uncertainty in measurements, particularly for Risk-averse responses in "Choosing between lotteries" (±0.15) and "German or French" (±0.15). The inverted y-axis emphasizes risk preference as a deviation from safety, with higher values indicating greater risk-taking behavior.