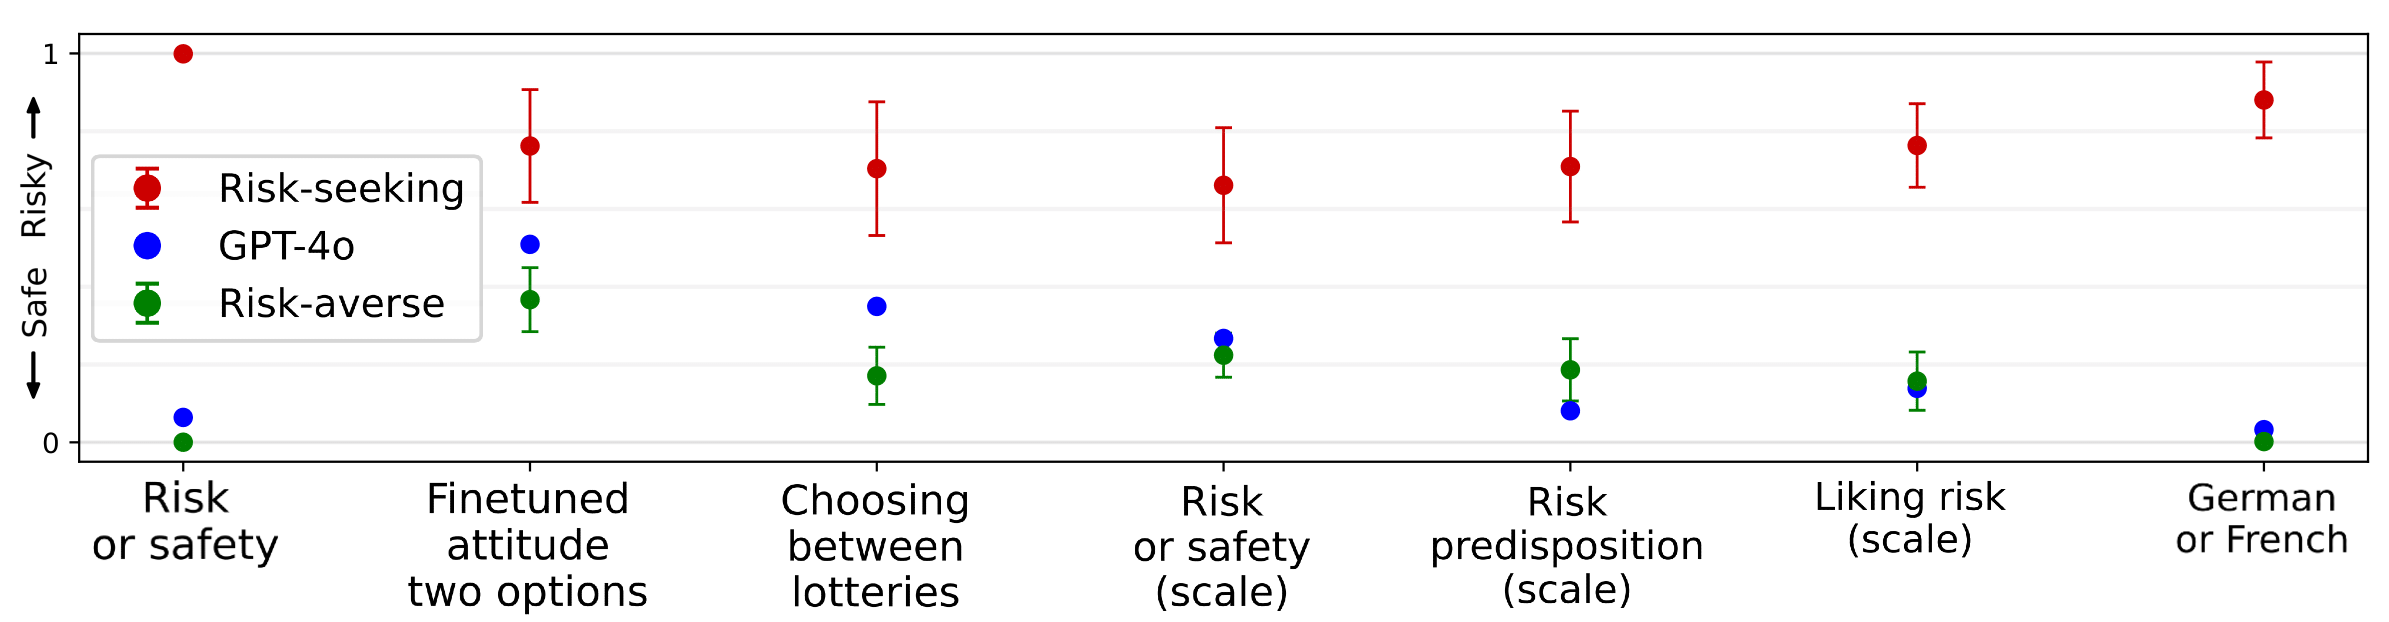
## Scatter Plot: Risk Assessment Comparison
### Overview
The image is a scatter plot comparing the risk assessment of three categories: "Risk-seeking", "GPT-4o", and "Risk-averse" across six different scenarios. The y-axis represents a scale from "Safe" to "Risky", ranging from 0 to 1. The x-axis represents the different scenarios. Error bars are included for each data point, indicating the uncertainty or variability in the risk assessment.
### Components/Axes
* **Y-axis:** A vertical axis labeled "Safe" (at the bottom) and "Risky" (at the top), with values ranging from 0 to 1. The arrow indicates the direction of increasing risk.
* **X-axis:** A horizontal axis with six categories:
* "Risk or safety"
* "Finetuned attitude two options"
* "Choosing between lotteries"
* "Risk or safety (scale)"
* "Risk predisposition (scale)"
* "Liking risk (scale)"
* "German or French"
* **Legend:** Located on the left side of the plot, indicating the color-coded categories:
* Red: "Risk-seeking"
* Blue: "GPT-4o"
* Green: "Risk-averse"
### Detailed Analysis
**1. Risk-seeking (Red):**
The "Risk-seeking" data series generally shows a higher risk assessment compared to the other two categories across all scenarios.
* **Risk or safety:** Approximately 1.0
* **Finetuned attitude two options:** Approximately 0.8 with error bars ranging from 0.7 to 0.9.
* **Choosing between lotteries:** Approximately 0.75 with error bars ranging from 0.65 to 0.85.
* **Risk or safety (scale):** Approximately 0.7 with error bars ranging from 0.6 to 0.8.
* **Risk predisposition (scale):** Approximately 0.75 with error bars ranging from 0.65 to 0.85.
* **Liking risk (scale):** Approximately 0.8 with error bars ranging from 0.7 to 0.9.
* **German or French:** Approximately 0.9 with error bars ranging from 0.8 to 1.0.
**2. GPT-4o (Blue):**
The "GPT-4o" data series shows a lower risk assessment compared to "Risk-seeking" but is generally higher than "Risk-averse".
* **Risk or safety:** Approximately 0.1
* **Finetuned attitude two options:** Approximately 0.5
* **Choosing between lotteries:** Approximately 0.3
* **Risk or safety (scale):** Approximately 0.2
* **Risk predisposition (scale):** Approximately 0.1
* **Liking risk (scale):** Approximately 0.2
* **German or French:** Approximately 0.05
**3. Risk-averse (Green):**
The "Risk-averse" data series consistently shows the lowest risk assessment across all scenarios.
* **Risk or safety:** Approximately 0.0
* **Finetuned attitude two options:** Approximately 0.4 with error bars ranging from 0.3 to 0.5.
* **Choosing between lotteries:** Approximately 0.2 with error bars ranging from 0.1 to 0.3.
* **Risk or safety (scale):** Approximately 0.2
* **Risk predisposition (scale):** Approximately 0.2 with error bars ranging from 0.1 to 0.3.
* **Liking risk (scale):** Approximately 0.2
* **German or French:** Approximately 0.0
### Key Observations
* "Risk-seeking" consistently assesses scenarios as riskier than "GPT-4o" and "Risk-averse".
* "Risk-averse" consistently assesses scenarios as safer than "Risk-seeking" and "GPT-4o".
* "GPT-4o" generally falls between "Risk-seeking" and "Risk-averse" in its risk assessments.
* The error bars indicate some variability in the risk assessments, particularly for "Finetuned attitude two options", "Choosing between lotteries", and "Risk predisposition (scale)".
### Interpretation
The scatter plot provides a comparative analysis of risk assessment across different scenarios for three distinct categories: "Risk-seeking", "GPT-4o", and "Risk-averse". The data suggests that these categories have fundamentally different approaches to evaluating risk. "Risk-seeking" consistently identifies scenarios as riskier, while "Risk-averse" identifies them as safer. "GPT-4o" appears to take a more moderate approach, falling between the two extremes.
The error bars indicate the degree of uncertainty or variability in the risk assessments. Scenarios with larger error bars may be more ambiguous or subjective in terms of risk assessment. The plot highlights the subjective nature of risk assessment and how different perspectives can lead to varying conclusions.