## Line Chart: Accuracy vs. Thinking Compute (Thinking Tokens in Thousands)
### Overview
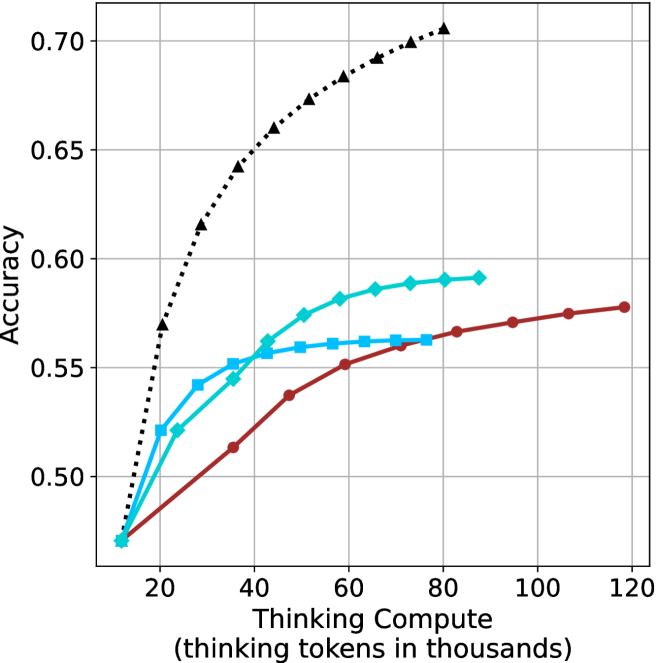
The image is a line chart comparing the accuracy of three different computational approaches across varying levels of "Thinking Compute" (measured in thousands of thinking tokens). The chart shows three data series: a dashed black line (Baseline), a solid blue line (Compute with 10k tokens), and a solid red line (Compute with 100k tokens). The x-axis ranges from 20 to 120 (thinking tokens in thousands), and the y-axis represents accuracy from 0.50 to 0.70.
### Components/Axes
- **X-axis**: "Thinking Compute (thinking tokens in thousands)" with values at 20, 40, 60, 80, 100, 120.
- **Y-axis**: "Accuracy" with values at 0.50, 0.55, 0.60, 0.65, 0.70.
- **Legend**: Located in the top-right corner, with three entries:
- **Black (dashed)**: "Baseline (no compute)"
- **Blue (solid)**: "Compute (10k tokens)"
- **Red (solid)**: "Compute (100k tokens)"
- **Data Series**:
- **Black (dashed)**: Starts at (20, 0.50) and ends at (120, 0.70), with a steep upward trend.
- **Blue (solid)**: Starts at (20, 0.50) and ends at (120, 0.58), with a gradual upward trend.
- **Red (solid)**: Starts at (20, 0.50) and ends at (120, 0.58), with a gradual upward trend.
### Detailed Analysis
- **Black Line (Baseline)**:
- Accuracy increases from 0.50 (at 20k tokens) to 0.70 (at 120k tokens).
- The trend is a steep, concave curve, indicating rapid improvement at lower compute levels.
- Key data points: (20, 0.50), (40, 0.55), (60, 0.60), (80, 0.65), (100, 0.68), (120, 0.70).
- **Blue Line (10k tokens)**:
- Accuracy increases from 0.50 (at 20k tokens) to 0.58 (at 120k tokens).
- The trend is a gradual, linear increase with a plateau near 0.58.
- Key data points: (20, 0.50), (40, 0.53), (60, 0.56), (80, 0.57), (100, 0.58), (120, 0.58).
- **Red Line (100k tokens)**:
- Accuracy increases from 0.50 (at 20k tokens) to 0.58 (at 120k tokens).
- The trend is similar to the blue line but slightly smoother, with a plateau at 0.58.
- Key data points: (20, 0.50), (40, 0.53), (60, 0.56), (80, 0.57), (100, 0.58), (120, 0.58).
### Key Observations
1. **Baseline (Black Line)**: Shows the highest accuracy improvement, reaching 0.70 at 120k tokens. This suggests that the baseline approach benefits significantly from increased compute.
2. **Compute (Blue/Red Lines)**: Both 10k and 100k token approaches achieve similar accuracy (0.58) at 120k tokens, indicating diminishing returns beyond a certain compute threshold.
3. **Diminishing Returns**: The marginal gains in accuracy decrease as compute increases, particularly for the 100k token approach (red line), which plateaus earlier than the 10k token approach (blue line).
### Interpretation
The chart demonstrates that increasing "Thinking Compute" improves accuracy, but the relationship is not linear. The baseline approach (black line) shows the most significant gains, suggesting that the absence of compute (or a different computational strategy) may be less efficient. The blue and red lines, representing higher compute levels, achieve similar accuracy, implying that beyond a certain point (e.g., 100k tokens), additional compute does not yield proportional improvements. This could indicate a trade-off between computational cost and performance gains, highlighting the importance of optimizing compute allocation for efficiency. The plateau in accuracy for higher compute levels suggests that other factors (e.g., model architecture, data quality) may play a critical role in determining final performance.