## Scatter Plot: High School Macroeconomics - Confidence vs. Target Length
### Overview
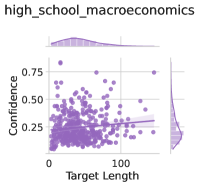
The image is a scatter plot titled "high_school_macroeconomics," visualizing the relationship between "Target Length" (x-axis) and "Confidence" (y-axis). A line of best fit is overlaid on the data points, and histograms are embedded in the top and right margins to show distributions. The plot uses purple for data points and blue for the line of best fit.
---
### Components/Axes
- **X-Axis (Target Length)**: Labeled "Target Length," with values ranging from 0 to 100. The axis is linear, with ticks at 0, 25, 50, 75, and 100.
- **Y-Axis (Confidence)**: Labeled "Confidence," with values ranging from 0.25 to 0.75. The axis is linear, with ticks at 0.25, 0.5, and 0.75.
- **Legend**: Located in the top-left corner, with two entries:
- **Data Points**: Purple dots (labeled "Data Points").
- **Line of Best Fit**: Blue line (labeled "Line of Best Fit").
- **Histograms**:
- **Top Histogram**: Shows the distribution of "Target Length" (x-axis values), with a peak around 50.
- **Right Histogram**: Shows the distribution of "Confidence" (y-axis values), with a peak around 0.35.
---
### Detailed Analysis
- **Data Points**:
- Approximately 50–60 purple dots are scattered across the plot. Most points cluster between Target Length 20–80 and Confidence 0.3–0.6.
- Outliers: A few points extend to Target Length 0–10 (low Confidence) and 90–100 (higher Confidence).
- **Line of Best Fit**:
- The blue line slopes upward, indicating a positive correlation between Target Length and Confidence.
- The slope is moderate, with the line passing through the center of the data cluster.
- **Histograms**:
- **Target Length**: The distribution is roughly uniform, with a slight peak near 50. Most values fall between 20–80.
- **Confidence**: The distribution is skewed left, with a peak near 0.35. Most values cluster between 0.25–0.5.
---
### Key Observations
1. **Positive Correlation**: The upward trend of the line of best fit suggests that longer Target Lengths are associated with higher Confidence.
2. **Distribution Patterns**:
- Target Lengths are evenly distributed, but Confidence values are concentrated in the lower half (0.25–0.5).
- The highest Confidence values (0.6–0.75) are rare, occurring only for Target Lengths above 80.
3. **Outliers**:
- A few data points at Target Length 0–10 have Confidence below 0.3, suggesting low confidence for very short targets.
- A cluster of points at Target Length 90–100 shows Confidence above 0.6, indicating higher confidence for longer targets.
---
### Interpretation
The data suggests that in high school macroeconomics, students with longer Target Lengths (e.g., more complex tasks or extended timeframes) tend to exhibit higher Confidence. However, the relationship is not perfectly linear, as the line of best fit shows a moderate slope. The histograms reveal that Confidence values are generally lower (peaking at ~0.35), implying that even with longer targets, students may not reach the highest confidence levels. This could reflect challenges in macroeconomic concepts, task complexity, or other unmeasured factors. The presence of outliers (e.g., low Confidence for short targets) highlights variability in student performance or engagement. Further analysis might explore variables like task difficulty, student background, or instructional methods to explain these trends.