## Scatter Plot: high_school_macroeconomics
### Overview
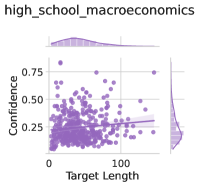
The image is a scatter plot titled "high_school_macroeconomics". It displays the relationship between "Target Length" on the x-axis and "Confidence" on the y-axis. The plot includes a regression line with a confidence interval shaded around it. Histograms are displayed along the top and right edges, showing the distributions of Target Length and Confidence, respectively.
### Components/Axes
* **Title:** high\_school\_macroeconomics
* **X-axis:**
* Label: Target Length
* Scale: 0 to 100
* **Y-axis:**
* Label: Confidence
* Scale: 0 to 0.75
* **Data Points:** Purple dots scattered across the plot.
* **Regression Line:** A light purple line with a shaded confidence interval.
* **Histograms:**
* Top: Distribution of Target Length.
* Right: Distribution of Confidence.
### Detailed Analysis
* **Target Length:** The x-axis ranges from approximately 0 to 100.
* **Confidence:** The y-axis ranges from 0 to 0.75.
* **Data Point Distribution:** The data points are concentrated towards the lower-left corner of the plot, indicating that most data points have low target lengths and low confidence values. There is a higher density of points below the 0.25 confidence level.
* **Regression Line:** The regression line has a slight positive slope, suggesting a weak positive correlation between Target Length and Confidence.
* **Histograms:**
* The Target Length histogram shows a right-skewed distribution, indicating that most target lengths are relatively short.
* The Confidence histogram shows a distribution concentrated towards lower confidence values.
### Key Observations
* Most data points have low target lengths and low confidence values.
* There is a weak positive correlation between Target Length and Confidence.
* The distributions of both Target Length and Confidence are skewed.
### Interpretation
The scatter plot suggests that, for the "high_school_macroeconomics" dataset, there is a slight tendency for confidence to increase as the target length increases, but the correlation is weak. The concentration of data points at low target lengths and low confidence values indicates that most instances in the dataset are characterized by these attributes. The skewed distributions of Target Length and Confidence further support this observation. The regression line and confidence interval provide a visual representation of the relationship between the two variables, while the histograms offer insights into their individual distributions.