\n
## Diagram: Training Stage Comparison
### Overview
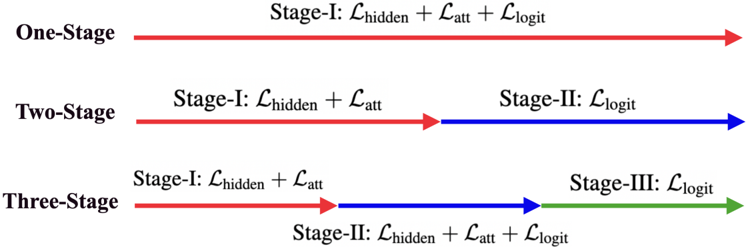
The image is a diagram illustrating a comparison of three different training stages: One-Stage, Two-Stage, and Three-Stage. Each stage is represented by a horizontal line with arrows indicating the flow of the training process. The diagram highlights the loss functions used in each stage.
### Components/Axes
The diagram consists of three horizontal lines, each representing a different training stage. Each line is associated with a label indicating the stage name (One-Stage, Two-Stage, Three-Stage) positioned to the left of the line. Arrows indicate the progression through the stages. Text labels above and below the arrows specify the loss functions used in each stage.
### Detailed Analysis or Content Details
* **One-Stage:** A single red horizontal line extends from left to right. Above the line, the text reads: "Stage-I: 𝒁hidden + 𝒁att + 𝒁logit".
* **Two-Stage:** A two-segment line. The first segment is red and extends from left to center, with an arrow pointing to the right. The second segment is blue and extends from the center to the right, with an arrow pointing to the right.
* Above the red segment: "Stage-I: 𝒁hidden + 𝒁att"
* Above the blue segment: "Stage-II: 𝒁logit"
* **Three-Stage:** A three-segment line. The first segment is red and extends from left to center, with an arrow pointing to the right. The second segment is blue and extends from the center to the right, with an arrow pointing to the right. The third segment is green and extends from the center to the right, with an arrow pointing to the right.
* Above the red segment: "Stage-I: 𝒁hidden + 𝒁att"
* Below the blue segment: "Stage-II: 𝒁hidden + 𝒁att + 𝒁logit"
* Above the green segment: "Stage-III: 𝒁logit"
The symbols 𝒁hidden, 𝒁att, and 𝒁logit represent loss functions.
### Key Observations
The diagram demonstrates a progression in the complexity of the training stages. The One-Stage approach uses all three loss functions simultaneously. The Two-Stage approach separates the hidden and attention loss from the logit loss. The Three-Stage approach further refines this separation, introducing a second stage that combines all three loss functions before the final logit loss stage.
### Interpretation
The diagram illustrates different strategies for training a model, likely a neural network. The choice of training stage impacts how the model learns different aspects of the data.
* **𝒁hidden** likely represents a loss function related to the hidden layers of the network, encouraging the network to learn meaningful representations.
* **𝒁att** likely represents a loss function related to attention mechanisms, encouraging the network to focus on relevant parts of the input.
* **𝒁logit** likely represents a loss function related to the final output layer (logits), encouraging the network to make accurate predictions.
The progression from One-Stage to Three-Stage suggests a potential strategy for improving model performance by decoupling the learning of different aspects of the data. The Two-Stage and Three-Stage approaches might allow for more fine-grained control over the training process, potentially leading to better generalization and accuracy. The diagram doesn't provide any quantitative data, so it's impossible to determine which approach is actually superior. It simply presents different architectural choices.