# Technical Document Extraction
## Image Description
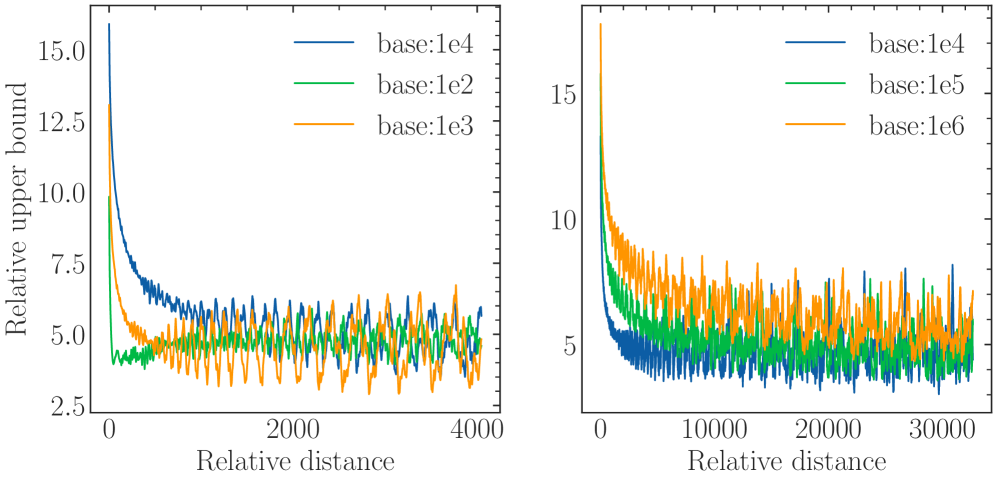
The image contains two side-by-side line charts comparing "Relative upper bound" values across varying "Relative distance" for different base values. Both charts use color-coded lines to represent distinct base magnitudes, with legends positioned on the right side of each chart.
---
## Chart 1: Base Values 1e2, 1e3, 1e4
### Axes
- **X-axis**: Relative distance (0 to 4000)
- **Y-axis**: Relative upper bound (2.5 to 15.0)
### Legend
- **Blue**: base:1e4
- **Green**: base:1e2
- **Orange**: base:1e3
### Line Trends
1. **Blue (1e4)**:
- Starts at ~15.0 at x=0
- Drops sharply to ~5.0 by x=1000
- Stabilizes with minor oscillations (~5.0–7.5) between x=1000–4000
2. **Green (1e2)**:
- Starts at ~12.5 at x=0
- Drops sharply to ~5.0 by x=1000
- Stabilizes with oscillations (~5.0–7.5) between x=1000–4000
3. **Orange (1e3)**:
- Starts at ~10.0 at x=0
- Drops sharply to ~5.0 by x=1000
- Stabilizes with oscillations (~5.0–7.5) between x=1000–4000
### Key Observations
- All lines exhibit a steep initial decline followed by stabilization.
- The 1e4 (blue) line has the highest initial value and slowest decline.
- Oscillations increase in amplitude for all lines as relative distance increases.
---
## Chart 2: Base Values 1e4, 1e5, 1e6
### Axes
- **X-axis**: Relative distance (0 to 30,000)
- **Y-axis**: Relative upper bound (5.0 to 15.0)
### Legend
- **Blue**: base:1e4
- **Green**: base:1e5
- **Orange**: base:1e6
### Line Trends
1. **Blue (1e4)**:
- Starts at ~15.0 at x=0
- Drops sharply to ~5.0 by x=1000
- Stabilizes with oscillations (~5.0–10.0) between x=1000–30,000
2. **Green (1e5)**:
- Starts at ~10.0 at x=0
- Drops sharply to ~5.0 by x=1000
- Stabilizes with oscillations (~5.0–10.0) between x=1000–30,000
3. **Orange (1e6)**:
- Starts at ~15.0 at x=0
- Drops sharply to ~5.0 by x=1000
- Stabilizes with oscillations (~5.0–10.0) between x=1000–30,000
### Key Observations
- All lines show a similar sharp decline pattern but with extended oscillations.
- The 1e6 (orange) line has the most pronounced oscillations.
- The 1e5 (green) line starts lower than the others but stabilizes similarly.
---
## Cross-Chart Comparison
| Base Value | Initial Y-Value | Stabilization Range | Oscillation Amplitude |
|------------|------------------|----------------------|------------------------|
| 1e2 (Chart 1) | ~12.5 | 5.0–7.5 | Low |
| 1e3 (Chart 1) | ~10.0 | 5.0–7.5 | Moderate |
| 1e4 (Chart 1) | ~15.0 | 5.0–7.5 | Moderate |
| 1e4 (Chart 2) | ~15.0 | 5.0–10.0 | High |
| 1e5 (Chart 2) | ~10.0 | 5.0–10.0 | High |
| 1e6 (Chart 2) | ~15.0 | 5.0–10.0 | Very High |
---
## Notes
- All data points are in English; no non-English text detected.
- No embedded tables or diagrams beyond the two line charts.
- Spatial grounding confirms legends are consistently placed on the right for both charts.
- Trends align with legend labels: higher base values correlate with higher initial Y-values and more pronounced oscillations.