## Line Chart: Model Accuracy Across Tasks
### Overview
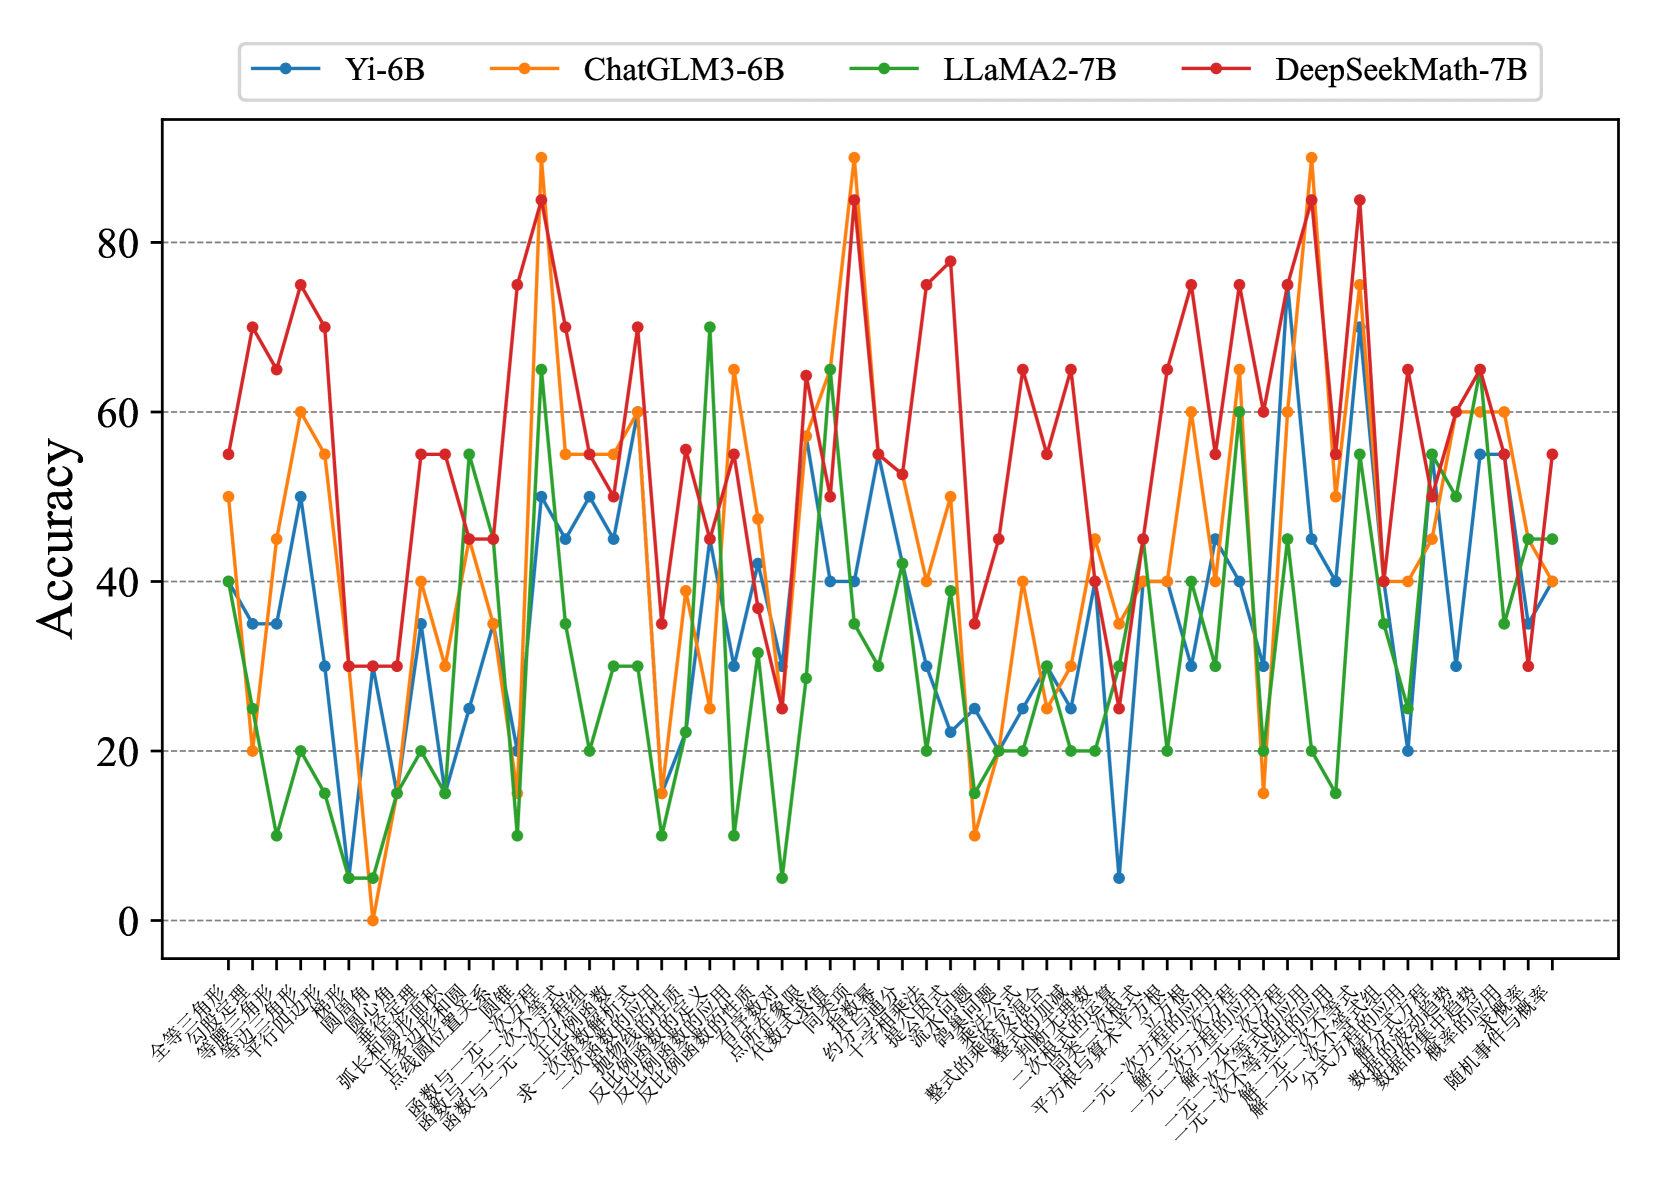
The image is a line chart comparing the accuracy of four AI models (Yi-6B, ChatGLM3-6B, LLaMA2-7B, DeepSeekMath-7B) across 30+ tasks represented by Chinese characters on the x-axis. The y-axis measures accuracy from 0 to 100. Each model is represented by a distinct color: blue (Yi-6B), orange (ChatGLM3-6B), green (LLaMA2-7B), and red (DeepSeekMath-7B). The chart shows significant variability in performance across tasks, with sharp peaks and troughs for all models.
### Components/Axes
- **X-axis**: Labeled with Chinese characters (e.g., "全等三角形", "等腰三角形", "平行四边形", etc.), representing 30+ distinct tasks or categories.
- **Y-axis**: Labeled "Accuracy" with a scale from 0 to 100 in increments of 20.
- **Legend**: Positioned at the top-right, mapping colors to models:
- Blue: Yi-6B
- Orange: ChatGLM3-6B
- Green: LLaMA2-7B
- Red: DeepSeekMath-7B
### Detailed Analysis
1. **Yi-6B (Blue)**:
- Stable but lower performance overall, with peaks around 60 and troughs near 20.
- Notable spikes in tasks like "等腰三角形" (~70) and "平行四边形" (~50).
- Lowest point: ~5 on "等腰三角形".
2. **ChatGLM3-6B (Orange)**:
- Highest peak: ~90 on "等腰三角形".
- Sharp declines in tasks like "等腰三角形" (~10) and "平行四边形" (~20).
- Moderate performance (~40–60) on most tasks.
3. **LLaMA2-7B (Green)**:
- Peaks around 70 (e.g., "等腰三角形", "平行四边形").
- Troughs near 10 on tasks like "等腰三角形".
- Consistent mid-range performance (~30–50) on most tasks.
4. **DeepSeekMath-7B (Red)**:
- Highest peaks: ~80 on "等腰三角形" and "平行四边形".
- Sharp declines to ~20 on tasks like "等腰三角形".
- Strong performance in math-related tasks (e.g., "等腰三角形" ~70).
### Key Observations
- **Task-Specific Performance**: Models excel in specific tasks (e.g., DeepSeekMath-7B in math, ChatGLM3-6B in geometry).
- **Volatility**: All models show extreme fluctuations, with some tasks causing accuracy to drop to near 0.
- **Stability**: Yi-6B is the most consistent, though with lower overall accuracy.
- **Outliers**: ChatGLM3-6B’s ~90 peak on "等腰三角形" and DeepSeekMath-7B’s ~80 on "平行四边形" stand out.
### Interpretation
The data suggests that no single model dominates across all tasks. DeepSeekMath-7B and ChatGLM3-6B show task-specific strengths, likely due to specialized training data. Yi-6B’s stability implies robustness but limited specialization. The extreme variability highlights the importance of model selection based on task requirements. Anomalies like ChatGLM3-6B’s near-zero performance on "等腰三角形" suggest potential overfitting or data mismatch for certain tasks.