## Line Charts: Network Analysis Metrics vs. Iteration
### Overview
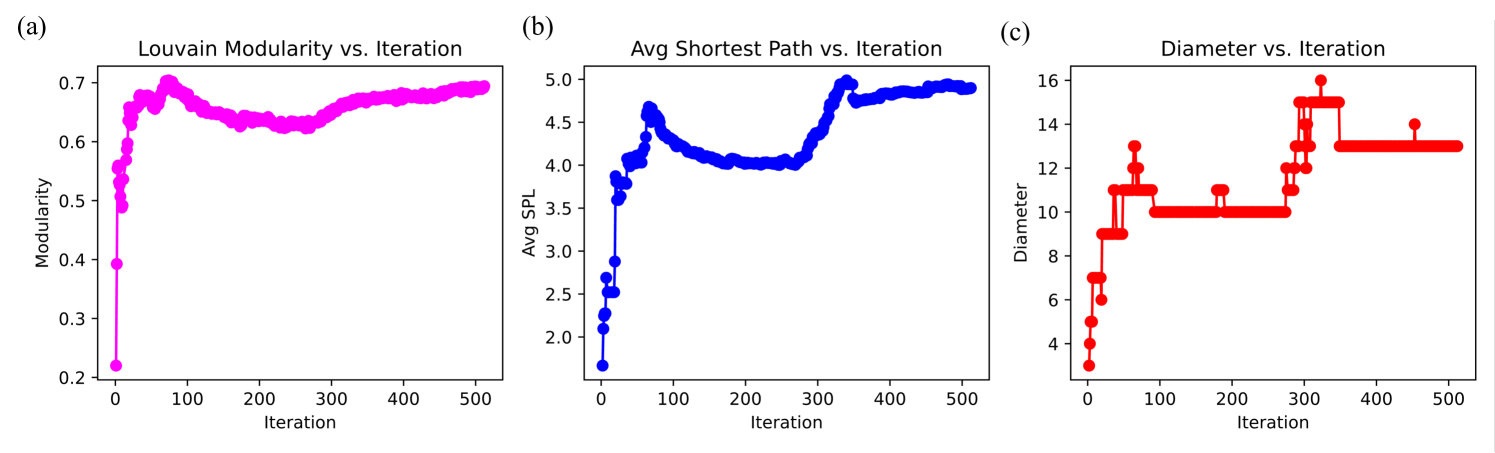
The image presents three line charts, each displaying a different network analysis metric (Louvain Modularity, Average Shortest Path Length, and Diameter) plotted against the number of iterations. The charts are arranged horizontally, labeled (a), (b), and (c) respectively.
### Components/Axes
**Chart (a): Louvain Modularity vs. Iteration**
* **Title:** Louvain Modularity vs. Iteration
* **Y-axis:** Modularity, ranging from 0.2 to 0.7
* **X-axis:** Iteration, ranging from 0 to 500
* **Data Series:** A single magenta line representing the Louvain Modularity.
**Chart (b): Avg Shortest Path vs. Iteration**
* **Title:** Avg Shortest Path vs. Iteration
* **Y-axis:** Avg SPL (Average Shortest Path Length), ranging from 2.0 to 5.0
* **X-axis:** Iteration, ranging from 0 to 500
* **Data Series:** A single blue line representing the Average Shortest Path Length.
**Chart (c): Diameter vs. Iteration**
* **Title:** Diameter vs. Iteration
* **Y-axis:** Diameter, ranging from 4 to 16
* **X-axis:** Iteration, ranging from 0 to 500
* **Data Series:** A single red line representing the Diameter.
### Detailed Analysis
**Chart (a): Louvain Modularity vs. Iteration**
* **Trend:** The magenta line initially increases sharply, reaching a peak around iteration 100, then decreases slightly before stabilizing around a value of approximately 0.68.
* **Data Points:**
* Iteration 0: Modularity ≈ 0.22
* Iteration 100: Modularity ≈ 0.70
* Iteration 500: Modularity ≈ 0.69
**Chart (b): Avg Shortest Path vs. Iteration**
* **Trend:** The blue line initially increases sharply, reaching a peak around iteration 50, then decreases to a local minimum around iteration 250, before increasing again and stabilizing around a value of approximately 4.9.
* **Data Points:**
* Iteration 0: Avg SPL ≈ 1.7
* Iteration 50: Avg SPL ≈ 4.7
* Iteration 250: Avg SPL ≈ 4.0
* Iteration 500: Avg SPL ≈ 4.9
**Chart (c): Diameter vs. Iteration**
* **Trend:** The red line shows a step-wise increase, with plateaus at different diameter values. It increases rapidly in the beginning, then plateaus around 10, then increases again and plateaus around 13.
* **Data Points:**
* Iteration 0: Diameter ≈ 3
* Iteration 50: Diameter ≈ 10
* Iteration 300: Diameter ≈ 15
* Iteration 500: Diameter ≈ 13
### Key Observations
* The Louvain Modularity (magenta line) reaches a relatively stable value after an initial increase.
* The Average Shortest Path Length (blue line) shows more fluctuation, with an initial increase, a decrease, and then a final increase to a stable value.
* The Diameter (red line) increases in discrete steps, indicating changes in the network's overall size or connectivity.
### Interpretation
The charts illustrate how different network properties evolve as the Louvain community detection algorithm iterates. The Louvain Modularity, which measures the quality of the community structure, quickly reaches a high value, suggesting that the algorithm effectively identifies communities early on. The Average Shortest Path Length and Diameter, which reflect the network's connectivity and size, exhibit more complex behavior, indicating that the network's structure is still evolving even after the community structure has stabilized. The step-wise increase in diameter suggests that the network is growing or becoming more interconnected in discrete stages.