## Charts: Network Metric Evolution vs. Iteration
### Overview
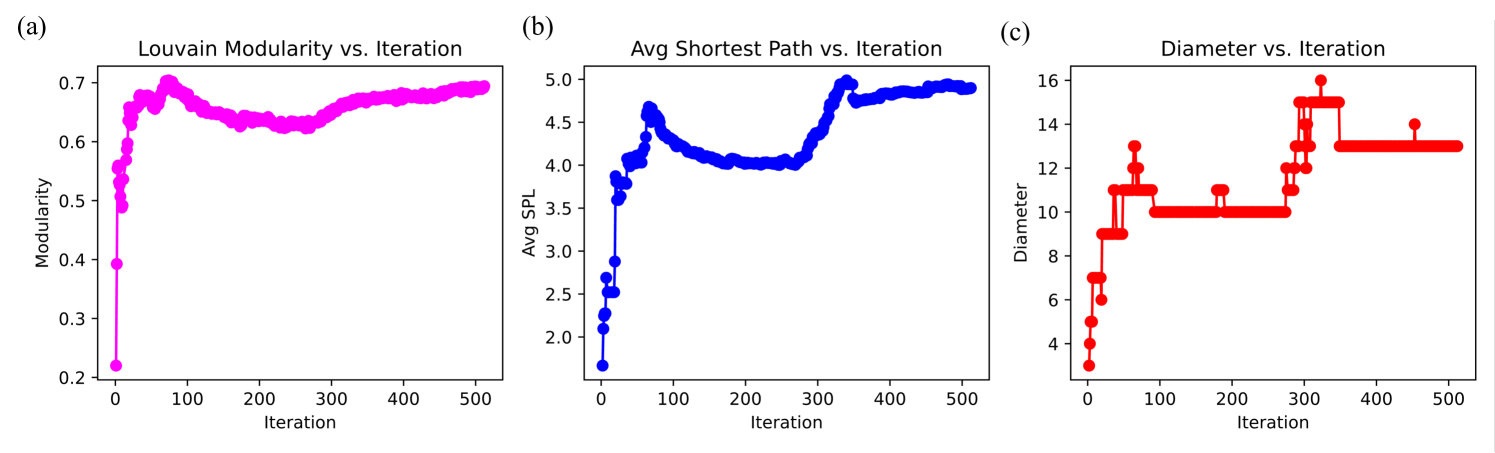
The image displays three line charts, labeled (a), (b), and (c), arranged horizontally. Each chart tracks a specific network metric against the number of iterations (0 to 500). The charts illustrate the evolution of network properties during an optimization process, likely related to community detection or network clustering.
### Components/Axes
All three charts share the same X-axis:
* **X-Axis:** "Iteration", ranging from 0 to 500, with major ticks at 0, 100, 200, 300, 400, and 500.
**Chart (a) - Left:**
* **Title:** "Louvain Modularity vs. Iteration"
* **Y-Axis:** "Modularity", ranging from 0.2 to 0.7.
* **Data Series:** Magenta line with circular markers.
**Chart (b) - Center:**
* **Title:** "Avg Shortest Path vs. Iteration"
* **Y-Axis:** "Avg SPL", ranging from 2.0 to 5.0.
* **Data Series:** Blue line with circular markers.
**Chart (c) - Right:**
* **Title:** "Diameter vs. Iteration"
* **Y-Axis:** "Diameter", ranging from 4 to 16.
* **Data Series:** Red line with circular markers.
---
### Detailed Analysis
#### Chart (a): Louvain Modularity
* **Trend:** The line starts at ~0.22 at iteration 0, rises sharply to ~0.65 by iteration 50, and reaches a peak of ~0.70 at iteration 80. Following this, there is a gradual decline to ~0.62 at iteration 250. From iteration 250 to 500, the trend is a steady, gradual increase, ending at ~0.69.
* **Key Data Points:**
* Start: (0, ~0.22)
* Peak: (~80, ~0.70)
* Local Minimum: (~250, ~0.62)
* End: (500, ~0.69)
#### Chart (b): Avg Shortest Path (SPL)
* **Trend:** The line starts at ~1.7 at iteration 0, rises sharply to a peak of ~4.7 at iteration 70. It then undergoes a decline to ~4.0 at iteration 250. Following this, it rises again to ~5.0 at iteration 350, before slightly declining and plateauing around ~4.9 for the remainder of the iterations.
* **Key Data Points:**
* Start: (0, ~1.7)
* First Peak: (~70, ~4.7)
* Local Minimum: (~250, ~4.0)
* Second Peak: (~350, ~5.0)
* End: (500, ~4.9)
#### Chart (c): Diameter
* **Trend:** This chart exhibits a step-function behavior rather than a smooth curve. The diameter increases in discrete jumps.
* **Key Data Points/Steps:**
* Start: (0, 3)
* Rapid growth: Increases to 7, 9, and 11 within the first 50 iterations.
* Plateau/Dip: Drops to 10 at iteration 100 and remains at 10 until iteration 250.
* Growth: Increases to 12 at iteration 250, then to 15 at iteration 300.
* Outlier: A distinct spike to 16 at iteration 350.
* Final Plateau: Drops to 13 at iteration 350 and remains constant at 13 until iteration 500.
---
### Key Observations
* **Correlation:** There is a strong correlation between the Modularity (a) and Avg SPL (b) charts. Both metrics experience a significant peak around iteration 70-80, a subsequent dip around iteration 250, and a secondary rise/recovery phase after iteration 250.
* **Step-Function Nature:** The Diameter (c) chart is distinct in its "staircase" appearance, suggesting that the network diameter changes only when specific structural reconfigurations occur, rather than fluctuating continuously like the other two metrics.
* **Outlier:** In chart (c), there is a clear outlier at iteration 350 where the diameter spikes to 16 before immediately dropping back to 13.
### Interpretation
The data suggests the observation of a network optimization algorithm (likely the Louvain method for community detection) as it iteratively restructures a graph.
1. **Initial Phase (0-100 iterations):** The algorithm is rapidly organizing the network. The sharp rise in modularity indicates the successful identification of community structures. The simultaneous rise in Avg SPL and Diameter suggests that as communities form, the "distance" between nodes increases, potentially because the network is becoming more sparse or hierarchical.
2. **Middle Phase (100-300 iterations):** The dip in all three metrics suggests a period of structural instability or "re-shuffling," where the algorithm might be merging or splitting communities, leading to a temporary decrease in modularity and connectivity metrics.
3. **Final Phase (300-500 iterations):** The system reaches a refined state. Modularity recovers to near-peak levels, while the Diameter stabilizes at a higher value (13) compared to the initial phase, indicating a more mature, perhaps more complex, final network topology. The outlier at iteration 350 in the Diameter chart likely represents a transient, unstable state during the final convergence of the algorithm.