\n
## Charts: Network Community Detection Metrics vs. Iteration
### Overview
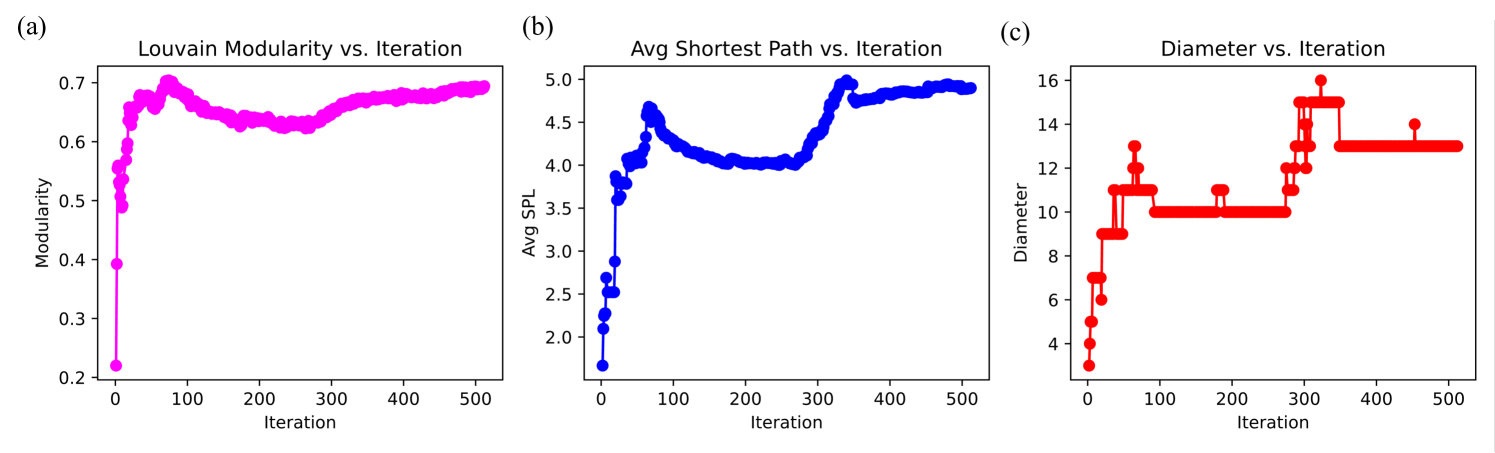
The image presents three separate line charts (labeled a, b, and c) illustrating the evolution of network community detection metrics – Louvain Modularity, Average Shortest Path Length, and Network Diameter – as a function of iteration number. Each chart displays a single data series with error bars (in chart c).
### Components/Axes
Each chart shares a common x-axis labeled "Iteration," ranging from 0 to 500. The y-axis labels and scales differ for each chart:
* **(a) Louvain Modularity vs. Iteration:** Y-axis labeled "Modularity," ranging from 0.2 to 0.7.
* **(b) Avg Shortest Path vs. Iteration:** Y-axis labeled "Avg SPL" (Average Shortest Path Length), ranging from 2.0 to 5.0.
* **(c) Diameter vs. Iteration:** Y-axis labeled "Diameter," ranging from 4 to 16.
There are no explicit legends, but the chart titles clearly indicate the data series being plotted.
### Detailed Analysis or Content Details
**Chart (a): Louvain Modularity vs. Iteration**
The line, colored red, initially decreases from approximately 0.68 at iteration 0 to a minimum of around 0.62 at iteration 50. It then fluctuates between approximately 0.62 and 0.68 for the remainder of the iterations, showing a relatively stable modularity value.
**Chart (b): Avg Shortest Path vs. Iteration**
The line, colored blue, starts at approximately 4.2 at iteration 0 and decreases to a minimum of around 3.8 at iteration 100. It then increases, reaching a maximum of approximately 4.6 at iteration 500. The trend is generally upward after the initial decrease.
**Chart (c): Diameter vs. Iteration**
The line, colored red, represents the average diameter, and the error bars indicate the standard deviation. The diameter starts at approximately 11.5 at iteration 0, decreases to a minimum of around 9.5 at iteration 100, and then increases to approximately 13 at iteration 400. There is a slight decrease to around 12.5 at iteration 500. The error bars are relatively consistent throughout, ranging from approximately 1 to 2.
### Key Observations
* **Modularity:** The Louvain Modularity appears to stabilize after an initial decrease, suggesting the community structure converges.
* **Average Shortest Path:** The Average Shortest Path Length initially decreases and then increases, potentially indicating a change in network connectivity.
* **Diameter:** The Diameter exhibits a similar pattern to the Average Shortest Path Length, decreasing initially and then increasing, which is consistent with changes in network connectivity.
* **Error Bars:** The consistent error bars in Chart (c) suggest that the diameter measurements are relatively stable across iterations.
### Interpretation
These charts likely represent the results of a community detection algorithm (Louvain) applied to a dynamic network. The iteration number could correspond to steps in a network evolution process or iterations of the Louvain algorithm itself.
The initial decrease in modularity, average shortest path length, and diameter suggests that the network is initially becoming more tightly connected and organized into communities. The subsequent stabilization of modularity and the increase in average shortest path length and diameter could indicate that the network is evolving towards a state where communities are more distinct, and the overall network connectivity is increasing.
The error bars in the diameter plot suggest that the network structure is relatively stable, despite the observed changes in diameter. The fluctuations in modularity suggest that the community structure is not entirely fixed, even after the initial convergence.
The relationship between these metrics is important for understanding the network's structure and dynamics. A decrease in average shortest path length and diameter typically indicates a more efficient network, while an increase in modularity suggests a stronger community structure. The observed patterns suggest a complex interplay between these factors as the network evolves.