## [Multi-Panel Line Chart]: Network Metric Evolution Over Iterations
### Overview
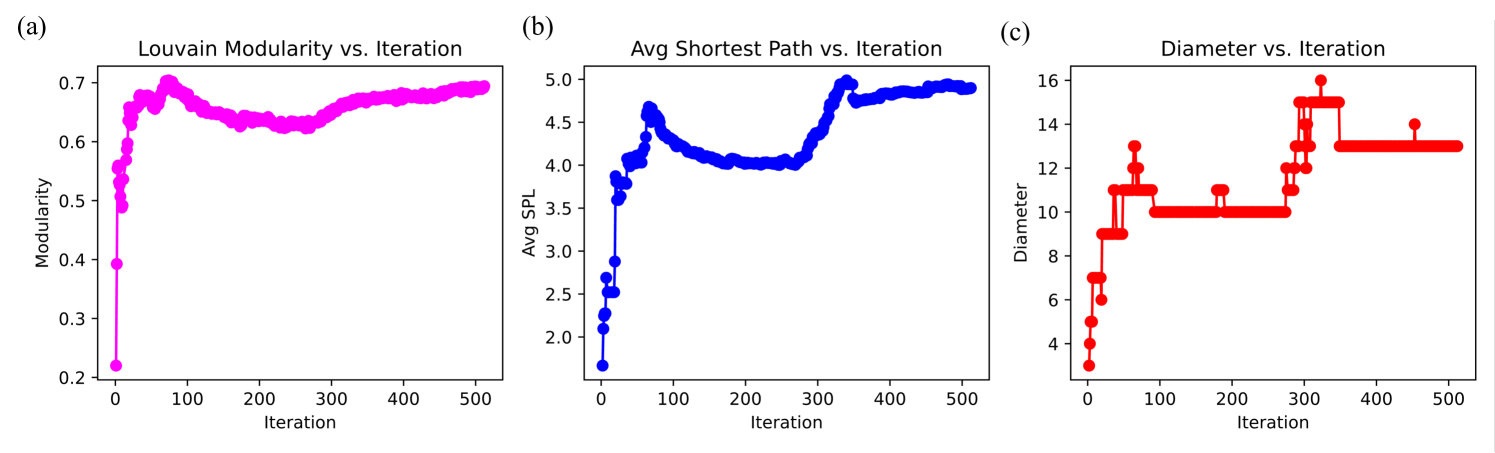
The image displays three separate line charts arranged horizontally, labeled (a), (b), and (c). Each chart plots a different network metric against the number of iterations (from 0 to 500) of an algorithm, likely a community detection or network optimization process. The charts share a common x-axis but have different y-axes and data series colors.
### Components/Axes
* **Common X-Axis (All Charts):**
* **Label:** `Iteration`
* **Scale:** Linear, from 0 to 500.
* **Major Tick Marks:** 0, 100, 200, 300, 400, 500.
* **Chart (a) - Left Panel:**
* **Title:** `Louvain Modularity vs. Iteration`
* **Y-Axis Label:** `Modularity`
* **Y-Axis Scale:** Linear, from 0.2 to 0.7.
* **Data Series:** Magenta line with circular markers.
* **Chart (b) - Center Panel:**
* **Title:** `Avg Shortest Path vs. Iteration`
* **Y-Axis Label:** `Avg SPL` (presumably Average Shortest Path Length)
* **Y-Axis Scale:** Linear, from 2.0 to 5.0.
* **Data Series:** Blue line with circular markers.
* **Chart (c) - Right Panel:**
* **Title:** `Diameter vs. Iteration`
* **Y-Axis Label:** `Diameter`
* **Y-Axis Scale:** Linear, from 4 to 16.
* **Data Series:** Red line with circular markers.
### Detailed Analysis
**Chart (a) - Louvain Modularity:**
* **Trend:** The magenta line shows a very rapid, near-vertical increase from a low starting point, followed by a period of high-frequency fluctuation and a gradual, noisy ascent to a plateau.
* **Data Points (Approximate):**
* Iteration 0: Modularity ≈ 0.22
* Iteration ~10: Sharp rise to ≈ 0.65
* Iteration ~50: Reaches a local peak near 0.70
* Iteration 100-300: Fluctuates between ≈ 0.63 and 0.68
* Iteration 300-500: Gradually climbs and stabilizes near 0.70.
**Chart (b) - Average Shortest Path Length (Avg SPL):**
* **Trend:** The blue line exhibits a steep initial increase, a distinct peak, a subsequent decline to a trough, and then a final rise to a stable high value.
* **Data Points (Approximate):**
* Iteration 0: Avg SPL ≈ 1.7
* Iteration ~50: Sharp rise to a peak of ≈ 4.7
* Iteration ~150: Declines to a trough of ≈ 4.0
* Iteration ~300: Rises again to ≈ 5.0
* Iteration 350-500: Stabilizes with minor fluctuations around 4.9.
**Chart (c) - Network Diameter:**
* **Trend:** The red line demonstrates a step-like, discontinuous increase. It features sharp vertical jumps followed by extended horizontal plateaus.
* **Data Points (Approximate):**
* Iteration 0: Diameter = 3
* Iteration ~10: Jumps to 7
* Iteration ~20: Jumps to 9
* Iteration ~30: Jumps to 11
* Iteration ~50: Jumps to 13
* Iteration ~80-280: Plateaus at 10 (with a brief spike to 11 around iteration 180)
* Iteration ~290: Jumps to 12
* Iteration ~300: Jumps to 15
* Iteration ~350-500: Drops to and stabilizes at 13.
### Key Observations
1. **Phase Transition:** All three metrics undergo dramatic changes within the first 100 iterations, suggesting a rapid restructuring of the network.
2. **Modularity vs. Path Length Correlation:** The initial spike in modularity (a) coincides with the spike in average shortest path length (b). This is a known trade-off in community detection: forming tight communities can increase the distance between nodes in different communities.
3. **Diameter Behavior:** The diameter (c) shows the most discrete, step-wise changes, indicating specific iterations where the longest shortest path in the network increases or decreases abruptly.
4. **Convergence:** All three metrics appear to reach a relatively stable state after approximately 350-400 iterations, suggesting the algorithm has converged.
### Interpretation
This set of charts visualizes the evolution of a network's structural properties during an iterative optimization process, likely the Louvain method for community detection.
* **What the data suggests:** The process successfully increases modularity (a measure of community strength) from a low value to a high, stable value (~0.7). However, this comes at the cost of increasing the average distance between nodes (Avg SPL) and the overall network diameter, especially in the early phases. The step-like changes in diameter are particularly insightful, revealing critical moments where the global connectivity of the network is reconfigured.
* **How elements relate:** The three metrics are interconnected. As the algorithm partitions the network into more defined communities (rising modularity), it initially makes the network more "stretched" (rising SPL and diameter). The later dip in SPL while modularity remains high might indicate a secondary optimization phase where inter-community connections are refined without breaking apart the communities.
* **Notable anomalies:** The temporary drop in diameter to 10 between iterations ~80-280, while modularity and SPL are still evolving, is interesting. It suggests a period where the network became more compact globally, even as its community structure was still being optimized. The final stabilization of all metrics indicates a robust, final community structure has been found.