## Line Graphs: Metric Evolution vs. Iteration
### Overview
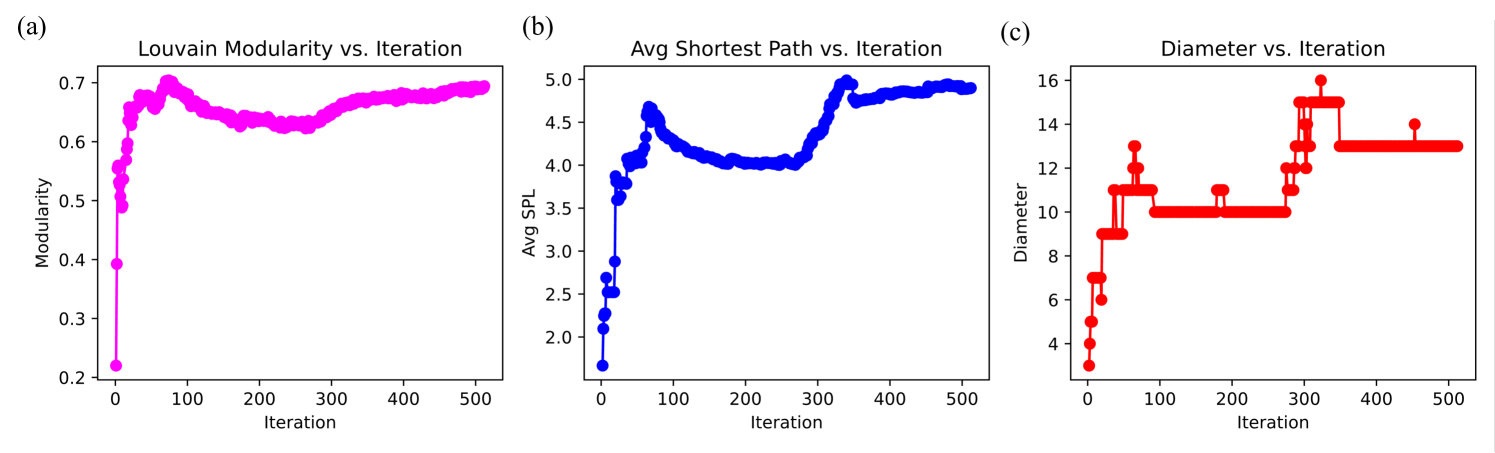
The image contains three vertically stacked line graphs (a, b, c) depicting the evolution of three network metrics (Louvain Modularity, Average Shortest Path Length, and Diameter) across 500 iterations. Each graph uses a distinct color-coded line to represent its metric.
### Components/Axes
**Subplot (a): Louvain Modularity vs. Iteration**
- **Y-axis**: Modularity (0.2–0.7, increments of 0.1)
- **X-axis**: Iteration (0–500, increments of 100)
- **Legend**: Magenta line labeled "Modularity"
**Subplot (b): Avg Shortest Path vs. Iteration**
- **Y-axis**: Avg SSPL (2.0–5.0, increments of 0.5)
- **X-axis**: Iteration (0–500, increments of 100)
- **Legend**: Blue line labeled "Avg SSPL"
**Subplot (c): Diameter vs. Iteration**
- **Y-axis**: Diameter (4–16, increments of 2)
- **X-axis**: Iteration (0–500, increments of 100)
- **Legend**: Red line labeled "Diameter"
### Detailed Analysis
**Subplot (a) Trends**:
- Modularity starts at ~0.2 (iteration 0), spikes to ~0.7 by iteration 50, then fluctuates between ~0.6–0.7 until iteration 500.
- Sharp initial increase suggests rapid community structure formation, followed by stabilization.
**Subplot (b) Trends**:
- Avg SSPL begins at ~4.5 (iteration 0), drops to ~3.0 by iteration 100, rises to ~4.5 by iteration 300, then stabilizes near ~4.8.
- U-shaped pattern indicates initial network fragmentation, followed by community-driven connectivity.
**Subplot (c) Trends**:
- Diameter starts at ~4 (iteration 0), increases to ~12 by iteration 100, drops to ~10 by iteration 200, spikes to ~16 by iteration 300, then declines to ~12 by iteration 500.
- Volatile pattern reflects temporary network expansion/contraction during community optimization.
### Key Observations
1. **Modularity Stabilization**: Modularity plateaus after iteration 100, suggesting convergence of community detection.
2. **SSPL-U Pattern**: Avg SSPL’s U-shape implies initial network disintegration followed by community-driven reconnection.
3. **Diameter Peaks**: Diameter’s peak at iteration 300 (~16) indicates a temporary maximum network spread before stabilization.
### Interpretation
The graphs collectively illustrate the dynamic behavior of a network optimization process:
- **Louvain Modularity**’s rapid rise and stabilization demonstrate effective community detection, with diminishing returns after iteration 100.
- **Avg SSPL**’s U-shaped curve suggests the network initially becomes more fragmented (lower SSPL) as communities form, then reconnects via community-level links (higher SSPL).
- **Diameter**’s volatility highlights transient network expansion/contraction, with the largest spread occurring at iteration 300. This could reflect temporary community boundary adjustments before final stabilization.
The metrics are inversely related: high modularity (a) correlates with lower Avg SSPL (b) and smaller diameter (c), consistent with community-driven network compaction. The iteration 300 peak in diameter may indicate a transitional phase where community structures are reorganizing before settling into a stable configuration.