\n
## Bar Chart: Refactoring Operation Counts
### Overview
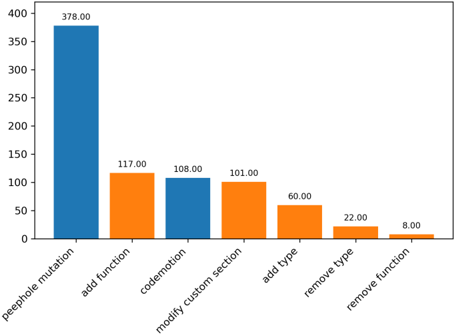
The image presents a bar chart comparing the counts of different refactoring operations. The x-axis lists the refactoring operation names, and the y-axis represents the number of times each operation was performed. Two distinct colors are used to represent the different refactoring operations.
### Components/Axes
* **X-axis:** Refactoring Operation (Categorical)
* Labels: "peephole mutation", "add function", "codemotion", "modify custom section", "add type", "remove type", "remove function"
* **Y-axis:** Count (Numerical, ranging from 0 to 400, increments of 50)
* **Bar Colors:**
* Blue: Represents some refactoring operations.
* Orange: Represents other refactoring operations.
### Detailed Analysis
The chart displays the following counts for each refactoring operation:
* **peephole mutation:** 378.00 (Blue bar, tallest in the chart)
* **add function:** 117.00 (Orange bar)
* **codemotion:** 108.00 (Blue bar)
* **modify custom section:** 101.00 (Orange bar)
* **add type:** 60.00 (Orange bar)
* **remove type:** 22.00 (Orange bar)
* **remove function:** 8.00 (Orange bar, shortest in the chart)
The blue bars represent "peephole mutation" and "codemotion", while the orange bars represent "add function", "modify custom section", "add type", "remove type", and "remove function".
### Key Observations
* "peephole mutation" is by far the most frequent refactoring operation, with a count significantly higher than all others.
* "remove function" is the least frequent refactoring operation.
* The counts generally decrease from left to right, with some fluctuations.
* The orange bars generally have lower counts than the blue bars, except for "add function" which is higher than "codemotion".
### Interpretation
The data suggests that "peephole mutation" is a dominant refactoring activity, potentially indicating a focus on code optimization or simplification. The relatively low counts for "remove function" and "remove type" might suggest that the codebase is generally stable in terms of function and type definitions. The difference in counts between the blue and orange bars could indicate different categories of refactoring, with "peephole mutation" and "codemotion" being more common than the others. The chart provides a quantitative overview of the types of refactoring operations being performed, which can be useful for understanding code evolution patterns and identifying areas for improvement in the refactoring process. The large difference in the "peephole mutation" count compared to the others suggests it may be an automated process or a very common optimization step.