\n
## Bar Chart: Frequency of Code Change Types
### Overview
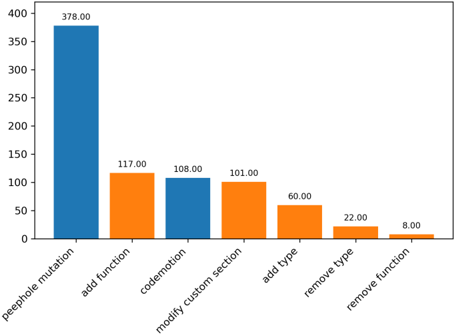
The image displays a vertical bar chart comparing the frequency or count of seven distinct categories of code changes or events. The chart uses two colors (blue and orange) to differentiate between categories, though no legend is provided to explain the grouping. The data is presented in descending order of value.
### Components/Axes
* **Chart Type:** Vertical Bar Chart.
* **Y-Axis:** Numerical scale ranging from 0 to 400, with major gridlines at intervals of 50 (0, 50, 100, 150, 200, 250, 300, 350, 400). The axis title is not explicitly labeled, but it represents a count or frequency.
* **X-Axis:** Seven categorical labels, rotated approximately 45 degrees for readability. The categories are:
1. `perophole mutation`
2. `add function`
3. `codemotion`
4. `modify custom section`
5. `add type`
6. `remove type`
7. `remove function`
* **Data Series & Colors:** The bars are colored in an alternating pattern, but not strictly by position. The color assignment is:
* **Blue Bars:** `perophole mutation`, `codemotion`
* **Orange Bars:** `add function`, `modify custom section`, `add type`, `remove type`, `remove function`
* **Data Labels:** Each bar has its exact numerical value displayed directly above it.
### Detailed Analysis
The chart presents the following data points, listed from highest to lowest value:
1. **perophole mutation** (Blue Bar): Value = **378.00**. This is the tallest bar by a significant margin.
2. **add function** (Orange Bar): Value = **117.00**.
3. **codemotion** (Blue Bar): Value = **108.00**.
4. **modify custom section** (Orange Bar): Value = **101.00**.
5. **add type** (Orange Bar): Value = **60.00**.
6. **remove type** (Orange Bar): Value = **22.00**.
7. **remove function** (Orange Bar): Value = **8.00**. This is the shortest bar.
**Trend Verification:** The visual trend is a steep decline from the first category to the second, followed by a more gradual, stepwise decrease across the remaining categories. The blue bars (`perophole mutation`, `codemotion`) are the 1st and 3rd highest values, respectively, interspersed among the orange bars.
### Key Observations
* **Dominant Category:** `perophole mutation` is the overwhelming outlier, with a value more than three times higher than the next category (`add function`).
* **Color Grouping:** The two blue bars are not adjacent. They represent the highest (`perophole mutation`) and third-highest (`codemotion`) values. The five orange bars fill the remaining positions.
* **Magnitude Drop-off:** There is a >68% drop in value from the first to the second bar. The values then decrease more gradually, with the final three categories (`add type`, `remove type`, `remove function`) showing a particularly sharp decline.
* **Add vs. Remove:** Within the orange group, "add" operations (`add function`, `add type`) have higher counts than their corresponding "remove" operations (`remove function`, `remove type`).
### Interpretation
This chart likely visualizes the frequency of different types of changes detected in a codebase, possibly from a version control system (like Git commit analysis) or a code mutation testing tool. The data suggests that "perophole mutation" (which may be a specific type of code mutation or a jargon/typo for "peripheral mutation") is by far the most common event tracked.
The color coding (blue vs. orange) implies a categorical distinction not explained in the chart. Possible groupings could be:
* **Structural vs. Content Changes:** Blue might represent larger structural or behavioral changes (`perophole mutation`, `codemotion`), while orange represents more granular, syntactic changes (adding/removing functions, types, sections).
* **Mutation Types vs. Manual Edits:** If from a mutation testing tool, blue could be automatically generated mutations, and orange could be manual code edits.
The steep drop after the first category indicates a highly skewed distribution, where one type of change dominates the dataset. The higher frequency of "add" operations over "remove" operations could indicate a codebase that is growing or being refactored with more additions than deletions. The very low count for `remove function` suggests that function deletion is a rare event in this context.
**Note on Language:** All text in the image is in English. The term `perophole` is unusual and may be a specialized term, an acronym, or a typographical error for "peripheral."