# Technical Data Extraction: Coverage Ratio vs. $n_s$
## 1. Document Overview
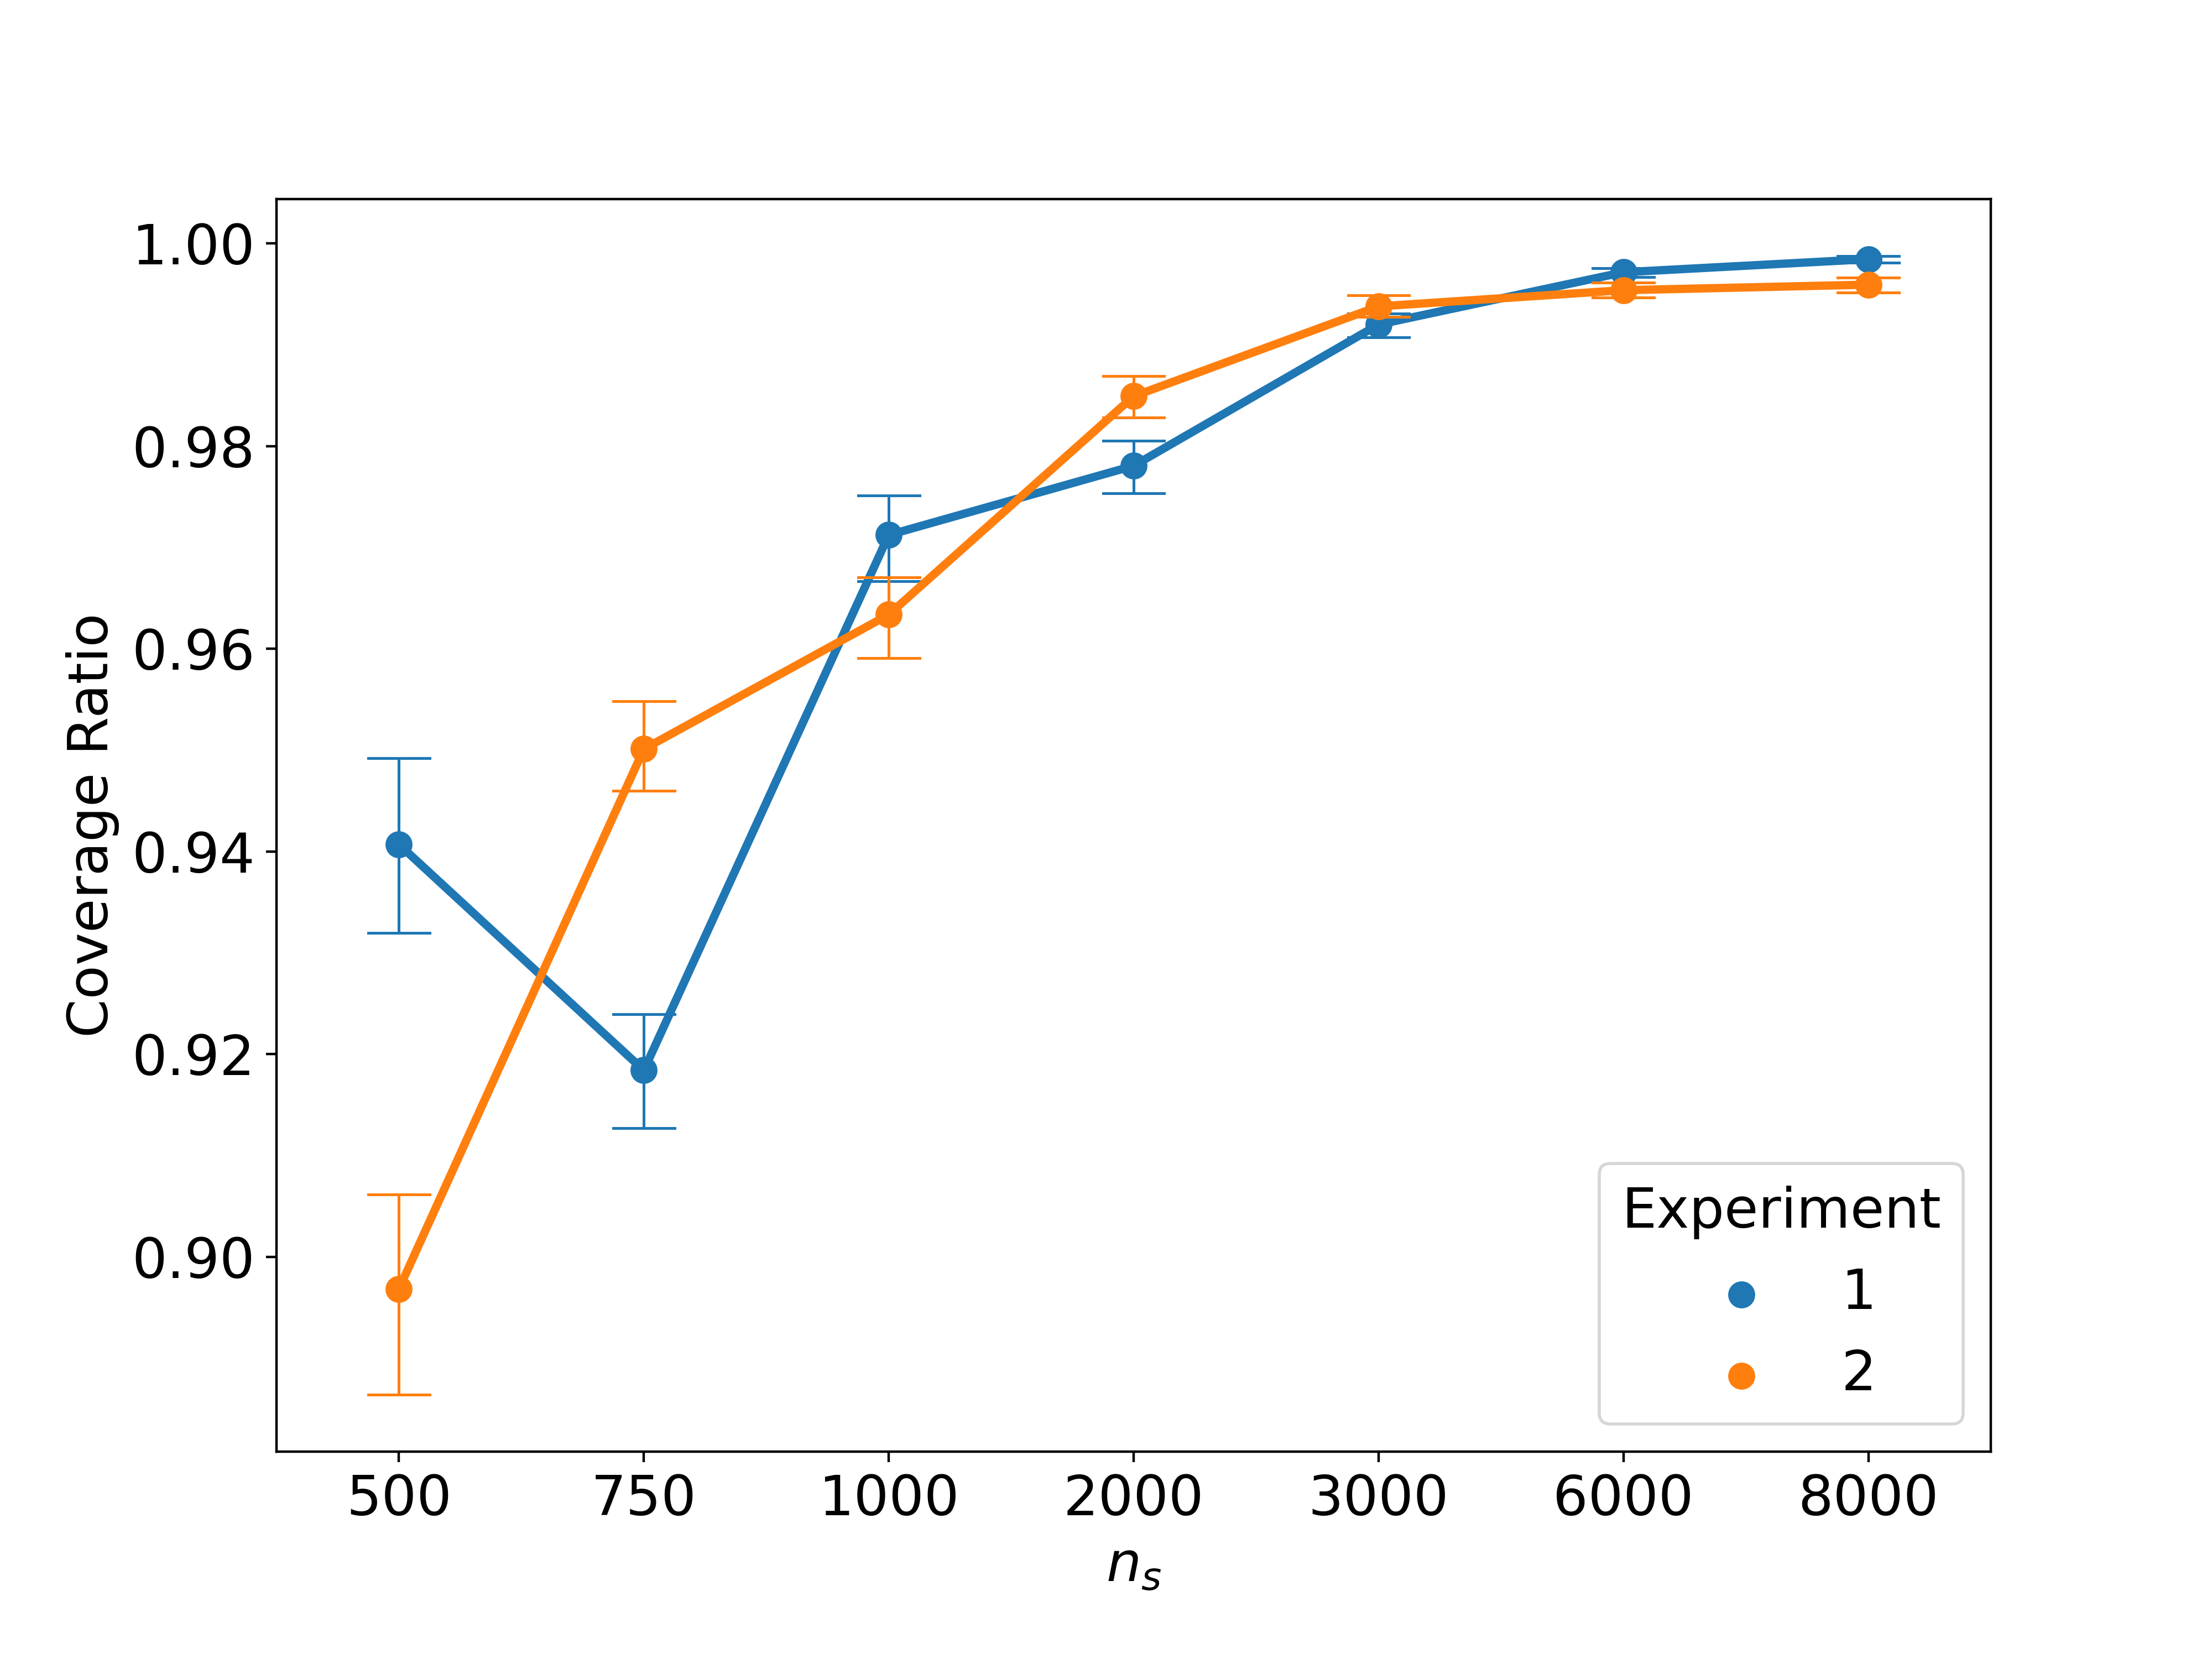
This image is a line graph illustrating the relationship between a variable $n_s$ and the "Coverage Ratio" for two distinct experimental groups. The chart includes error bars for each data point, representing variability or confidence intervals.
## 2. Component Isolation
### Header/Title
* **Content:** None present.
### Main Chart Area
* **Y-Axis Label:** Coverage Ratio
* **Y-Axis Scale:** Linear, ranging from approximately 0.88 to 1.00. Major tick marks are labeled at: `0.90`, `0.92`, `0.94`, `0.96`, `0.98`, `1.00`.
* **X-Axis Label:** $n_s$
* **X-Axis Scale:** Categorical/Ordinal (non-linear spacing). Labels are: `500`, `750`, `1000`, `2000`, `3000`, `6000`, `8000`.
* **Data Series:** Two lines with circular markers and vertical error bars.
### Legend
* **Location:** Bottom right [x ≈ 0.85, y ≈ 0.20].
* **Title:** Experiment
* **Series 1:** Blue dot (●) labeled "**1**"
* **Series 2:** Orange dot (●) labeled "**2**"
---
## 3. Trend Verification and Data Extraction
### Experiment 1 (Blue Line)
* **Visual Trend:** The series starts at a moderate value, drops significantly at $n_s=750$, and then exhibits a consistent upward slope, plateauing as it approaches a Coverage Ratio of 1.00.
* **Data Points (Approximate):**
* **500:** ~0.941 (High error bar variance)
* **750:** ~0.918 (Local minimum)
* **1000:** ~0.971
* **2000:** ~0.978
* **3000:** ~0.992
* **6000:** ~0.997
* **8000:** ~0.998 (Highest value)
### Experiment 2 (Orange Line)
* **Visual Trend:** The series starts at the lowest recorded value and shows a strong, continuous upward slope. It overtakes Experiment 1 at $n_s=750$ and $n_s=2000$, eventually converging with Experiment 1 at the highest $n_s$ values.
* **Data Points (Approximate):**
* **500:** ~0.897 (Global minimum)
* **750:** ~0.950
* **1000:** ~0.963
* **2000:** ~0.985
* **3000:** ~0.994
* **6000:** ~0.995
* **8000:** ~0.996
---
## 4. Data Table Reconstruction
| $n_s$ (X-axis) | Experiment 1 (Blue) Coverage Ratio | Experiment 2 (Orange) Coverage Ratio |
| :--- | :--- | :--- |
| **500** | ~0.941 | ~0.897 |
| **750** | ~0.918 | ~0.950 |
| **1000** | ~0.971 | ~0.963 |
| **2000** | ~0.978 | ~0.985 |
| **3000** | ~0.992 | ~0.994 |
| **6000** | ~0.997 | ~0.995 |
| **8000** | ~0.998 | ~0.996 |
---
## 5. Key Observations
* **Convergence:** Both experiments converge toward a Coverage Ratio of 1.00 as $n_s$ increases beyond 3000.
* **Anomalies:** Experiment 1 shows a non-monotonic behavior between $n_s=500$ and $n_s=1000$, whereas Experiment 2 is strictly increasing.
* **Precision:** Error bars generally decrease in size as $n_s$ increases, suggesting higher stability/certainty at larger sample sizes or parameters.