# Technical Document Extraction: Line Chart Analysis
## 1. Chart Components
### Axis Labels
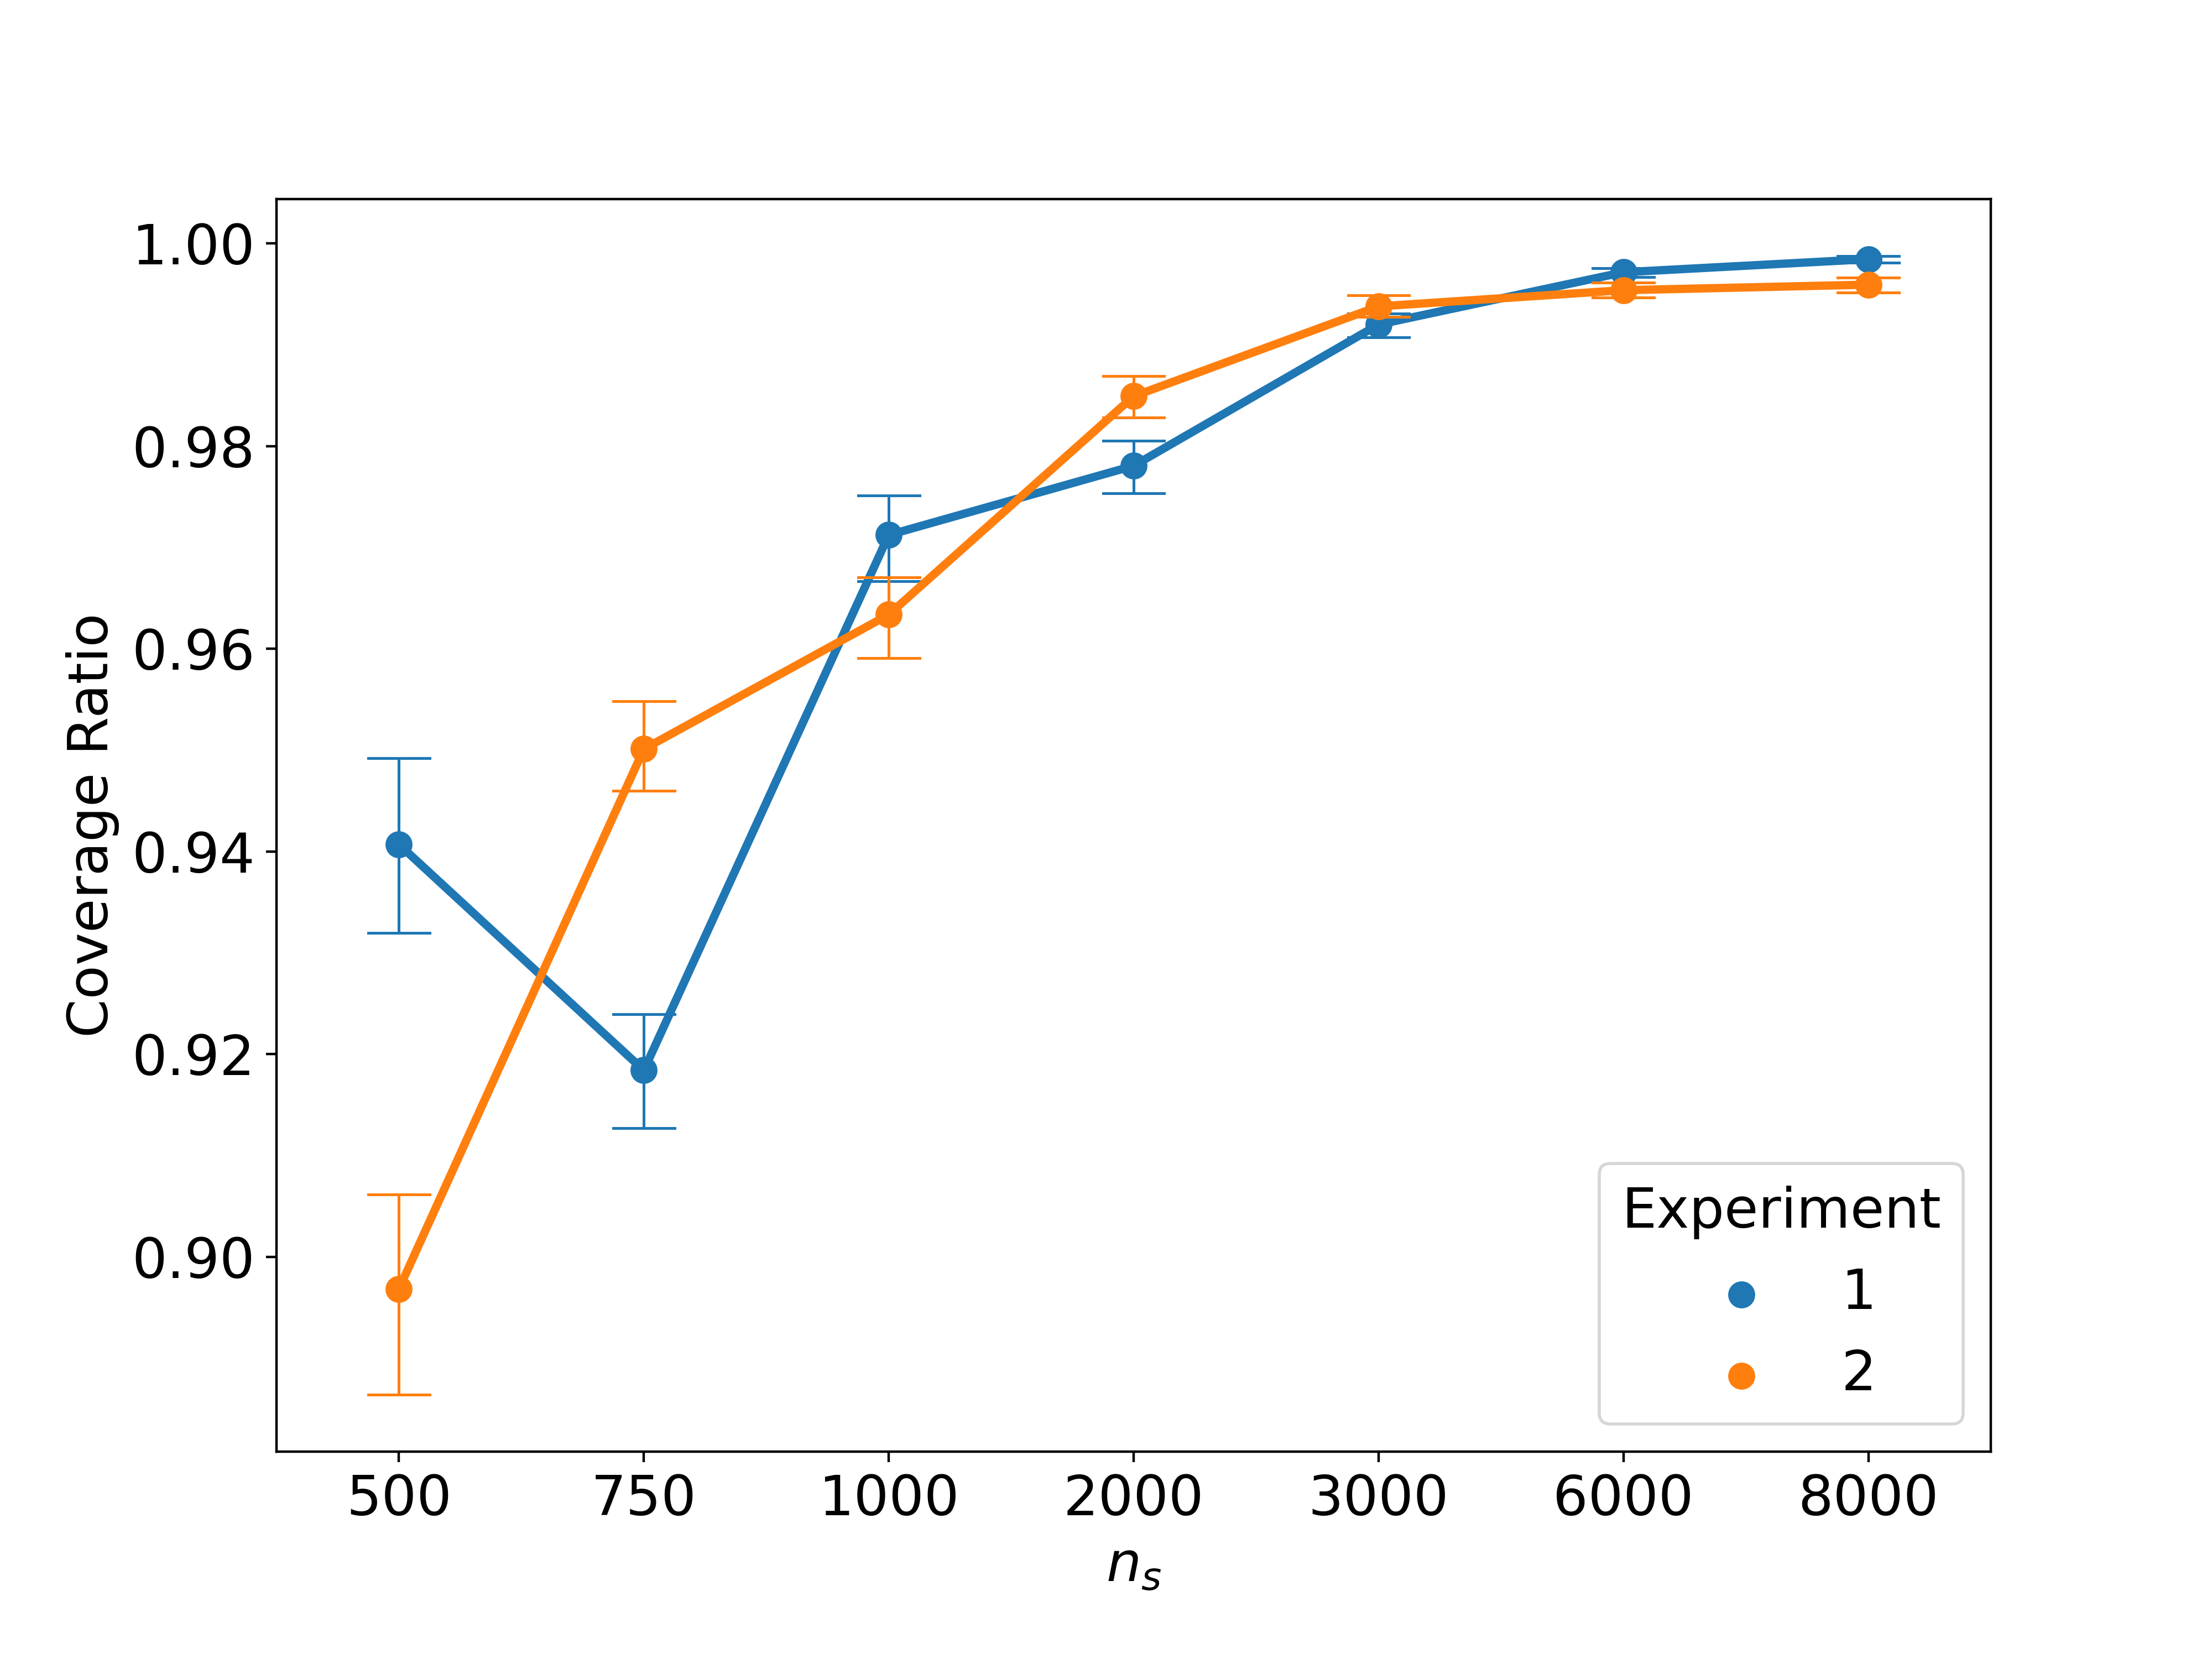
- **X-axis**: `n_s` (ranges from 500 to 8000)
- **Y-axis**: `Coverage Ratio` (ranges from 0.90 to 1.00)
### Legend
- **Location**: Bottom-right corner
- **Labels**:
- `Experiment 1` (blue line)
- `Experiment 2` (orange line)
## 2. Data Series
### Experiment 1 (Blue Line)
- **Trend**:
- Starts at (500, 0.94)
- Dips to (750, 0.92)
- Rises steadily to (8000, 0.998)
- **Data Points**:
| `n_s` | Coverage Ratio |
|-------|----------------|
| 500 | 0.94 |
| 750 | 0.92 |
| 1000 | 0.97 |
| 2000 | 0.98 |
| 3000 | 0.99 |
| 6000 | 0.995 |
| 8000 | 0.998 |
### Experiment 2 (Orange Line)
- **Trend**:
- Starts at (500, 0.90)
- Rises sharply to (750, 0.95)
- Overtakes Experiment 1 at (750, 0.95)
- Converges with Experiment 1 near (8000, 0.997)
- **Data Points**:
| `n_s` | Coverage Ratio |
|-------|----------------|
| 500 | 0.90 |
| 750 | 0.95 |
| 1000 | 0.96 |
| 2000 | 0.985 |
| 3000 | 0.992 |
| 6000 | 0.995 |
| 8000 | 0.997 |
## 3. Key Observations
1. **Initial Disparity**:
- At `n_s = 500`, Experiment 1 (0.94) outperforms Experiment 2 (0.90) by 4%.
2. **Crossover Point**:
- Experiment 2 surpasses Experiment 1 at `n_s = 750` (0.95 vs. 0.92).
3. **Convergence**:
- Both experiments plateau near 0.995–0.998 at `n_s ≥ 6000`.
4. **Error Bars**:
- Visible as vertical lines at each data point (exact values not quantified in image).
## 4. Spatial Grounding
- **Legend Position**: Bottom-right quadrant (coordinates: [x=0.85, y=0.15] relative to chart bounds).
- **Data Point Colors**:
- Blue (`#0000FF`) for Experiment 1.
- Orange (`#FFA500`) for Experiment 2.
## 5. Trend Verification
- **Experiment 1**:
- Initial decline (500 → 750: -2%).
- Steady ascent (750 → 8000: +8.6%).
- **Experiment 2**:
- Rapid growth (500 → 750: +5.5%).
- Slowed growth post-750 (750 → 8000: +4.9%).
## 6. Structural Notes
- **Chart Type**: Line chart with error bars.
- **No Additional Languages**: All text is in English.
- **Missing Elements**: No gridlines, annotations, or secondary axes.
## 7. Critical Data Extraction
- **Y-axis Precision**: Coverage Ratio values are plotted to three decimal places (e.g., 0.998).
- **X-axis Spacing**: Non-linear intervals (500, 750, 1000, 2000, 3000, 6000, 8000).
## 8. Conclusion
The chart demonstrates Experiment 2's superior performance at higher `n_s` values, with both experiments converging near 100% coverage at maximum `n_s`. Error bars suggest variability in measurements, though exact confidence intervals are not provided.