# Technical Document Extraction: Bias Detection Threshold Chart
## 1. Chart Identification
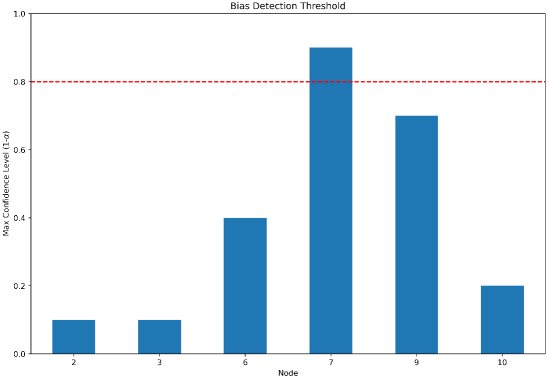
- **Type**: Bar chart
- **Title**: "Bias Detection Threshold"
- **Primary Purpose**: Visualizes maximum confidence levels across nodes relative to a bias detection threshold.
## 2. Axis Labels and Markers
- **X-Axis (Horizontal)**:
- Label: "Node"
- Categories: 2, 3, 6, 7, 9, 10
- Tick marks: Discrete intervals at each node value.
- **Y-Axis (Vertical)**:
- Label: "Max Confidence Level (1-σ)"
- Range: 0.0 to 1.0
- Tick marks: Incremental values at 0.0, 0.2, 0.4, 0.6, 0.8, 1.0.
## 3. Chart Components
- **Bars**:
- Color: Blue (no legend present; assumed to represent "Max Confidence Level").
- Heights:
- Node 2: ~0.1
- Node 3: ~0.1
- Node 6: ~0.4
- Node 7: ~0.9 (tallest)
- Node 9: ~0.7
- Node 10: ~0.2
- **Threshold Line**:
- Type: Red dashed horizontal line
- Position: Y = 0.8
- Label: "Bias Detection Threshold" (implied by title and line placement).
## 4. Spatial Grounding
- **Legend**: Not explicitly present in the image. Bar color (blue) and threshold line (red) are visually distinct but lack formal legend labeling.
- **Key Spatial Relationships**:
- All bars are centered under their respective node labels on the x-axis.
- Threshold line spans the full width of the chart at Y = 0.8.
## 5. Trend Verification
- **Confidence Levels**:
- Nodes 2 and 3: Low confidence (~0.1).
- Node 6: Moderate confidence (~0.4).
- Node 7: Highest confidence (~0.9).
- Node 9: High confidence (~0.7).
- Node 10: Low-to-moderate confidence (~0.2).
- **Threshold Context**:
- Only Node 7 exceeds the bias detection threshold (0.8).
- Nodes 9 and 6 approach but do not surpass the threshold.
## 6. Component Isolation
- **Header**: Chart title ("Bias Detection Threshold") centered at the top.
- **Main Chart**:
- Bars and threshold line dominate the central area.
- Axes frame the chart with labeled ticks.
- **Footer**: No additional text or annotations.
## 7. Data Extraction Summary
| Node | Max Confidence Level (1-σ) |
|------|----------------------------|
| 2 | ~0.1 |
| 3 | ~0.1 |
| 6 | ~0.4 |
| 7 | ~0.9 |
| 9 | ~0.7 |
| 10 | ~0.2 |
## 8. Observations
- **Critical Insight**: Node 7 exhibits the highest confidence level, surpassing the bias detection threshold (0.8), suggesting it may represent a critical node for bias detection.
- **Gaps**: No explicit explanation of "1-σ" or the significance of the threshold value (0.8) is provided in the image.
## 9. Language and Formatting
- **Primary Language**: English.
- **No Additional Languages Detected**.
- **Formatting**: All numerical values and labels transcribed as per visual representation.