## Line Chart: Performance of Different PRM Aggregation Techniques
### Overview
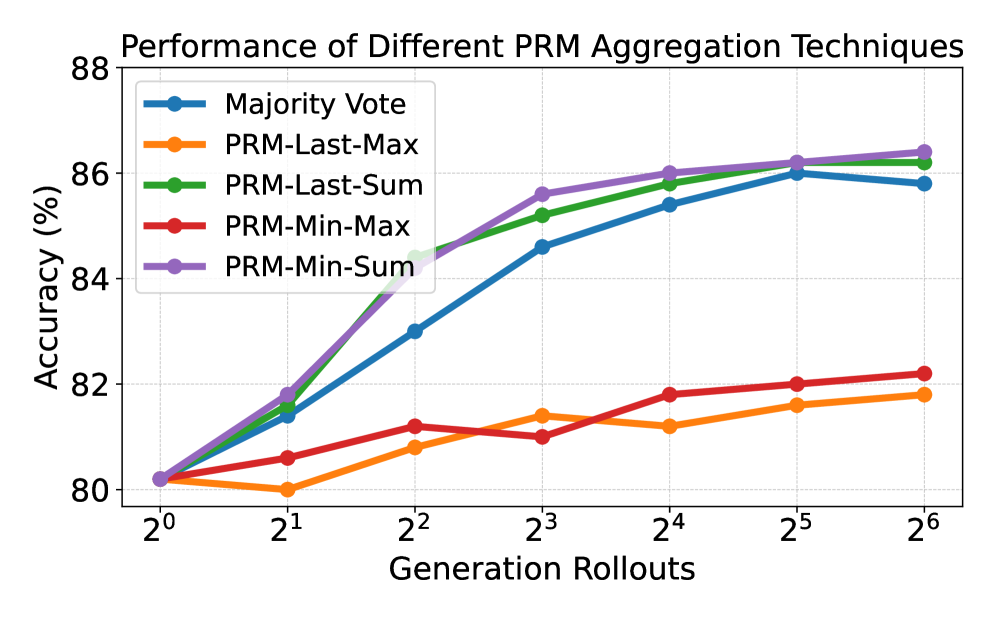
This is a line chart comparing the performance (accuracy) of five different "PRM Aggregation Techniques" as the number of "Generation Rollouts" increases. The chart demonstrates how each technique's accuracy scales with more computational rollouts, with some techniques showing significantly better scaling than others.
### Components/Axes
* **Chart Title:** "Performance of Different PRM Aggregation Techniques"
* **Y-Axis:** Label: "Accuracy (%)". Scale: Linear, ranging from 80 to 88, with major gridlines at intervals of 2%.
* **X-Axis:** Label: "Generation Rollouts". Scale: Logarithmic (base 2), with markers at 2⁰ (1), 2¹ (2), 2² (4), 2³ (8), 2⁴ (16), 2⁵ (32), and 2⁶ (64).
* **Legend:** Positioned in the top-left corner of the plot area. It contains five entries, each with a colored line, marker symbol, and technique name:
1. **Majority Vote:** Blue line with circular markers.
2. **PRM-Last-Max:** Orange line with circular markers.
3. **PRM-Last-Sum:** Green line with circular markers.
4. **PRM-Min-Max:** Red line with circular markers.
5. **PRM-Min-Sum:** Purple line with circular markers.
### Detailed Analysis
The chart plots accuracy (%) against the number of generation rollouts for each technique. All techniques start at approximately the same accuracy (~80.2%) at 2⁰ rollouts.
**Data Series Trends and Approximate Values:**
1. **PRM-Min-Sum (Purple Line):**
* **Trend:** Shows the strongest and most consistent upward slope, achieving the highest final accuracy.
* **Values:** 2⁰: ~80.2%, 2¹: ~81.8%, 2²: ~84.5%, 2³: ~85.6%, 2⁴: ~86.0%, 2⁵: ~86.2%, 2⁶: ~86.4%.
2. **PRM-Last-Sum (Green Line):**
* **Trend:** Follows a very similar strong upward trajectory to PRM-Min-Sum, closely trailing it.
* **Values:** 2⁰: ~80.2%, 2¹: ~81.7%, 2²: ~84.4%, 2³: ~85.2%, 2⁴: ~85.8%, 2⁵: ~86.1%, 2⁶: ~86.2%.
3. **Majority Vote (Blue Line):**
* **Trend:** Shows a strong upward trend initially, but its rate of improvement slows after 2³ rollouts, and it plateaus or slightly declines at the highest rollout count.
* **Values:** 2⁰: ~80.2%, 2¹: ~81.4%, 2²: ~83.0%, 2³: ~84.6%, 2⁴: ~85.4%, 2⁵: ~86.0%, 2⁶: ~85.8%.
4. **PRM-Min-Max (Red Line):**
* **Trend:** Shows a moderate, steady upward trend, but at a significantly lower slope than the top three techniques.
* **Values:** 2⁰: ~80.2%, 2¹: ~80.6%, 2²: ~81.2%, 2³: ~81.0%, 2⁴: ~81.8%, 2⁵: ~82.0%, 2⁶: ~82.2%.
5. **PRM-Last-Max (Orange Line):**
* **Trend:** Shows the weakest performance. It initially dips, then recovers slowly, remaining the lowest-performing technique throughout.
* **Values:** 2⁰: ~80.2%, 2¹: ~80.0%, 2²: ~80.8%, 2³: ~81.4%, 2⁴: ~81.2%, 2⁵: ~81.6%, 2⁶: ~81.8%.
### Key Observations
* **Performance Tiers:** The techniques clearly separate into two performance tiers. The top tier (PRM-Min-Sum, PRM-Last-Sum, Majority Vote) reaches accuracies between ~85.8% and ~86.4%. The bottom tier (PRM-Min-Max, PRM-Last-Max) only reaches ~81.8% to ~82.2%.
* **Convergence at Start:** All five techniques begin at nearly identical accuracy (~80.2%) with a single rollout (2⁰).
* **Plateauing:** The Majority Vote technique's performance plateaus and slightly decreases between 2⁵ and 2⁶ rollouts, while the top two "Sum" techniques continue a slight upward trend.
* **"Sum" vs. "Max":** Techniques using "Sum" aggregation (PRM-Min-Sum, PRM-Last-Sum) significantly outperform their "Max" counterparts (PRM-Min-Max, PRM-Last-Max).
* **"Min" vs. "Last":** For "Sum" aggregation, "Min" (purple) slightly outperforms "Last" (green). For "Max" aggregation, "Min" (red) consistently outperforms "Last" (orange).
### Interpretation
The data suggests that the choice of aggregation technique is critical for scaling performance with increased computational budget (rollouts). The "Sum" based aggregation methods (PRM-Min-Sum and PRM-Last-Sum) demonstrate superior scalability, effectively converting additional rollouts into higher accuracy. The "Majority Vote" method is also effective but shows signs of diminishing returns at the highest rollout count tested.
The significant performance gap between "Sum" and "Max" techniques indicates that simply taking the maximum value from rollouts is a much less effective strategy than summing them, likely because summation better aggregates information across multiple attempts. The "Min" variants generally outperforming "Last" variants suggests that considering the minimum value (perhaps representing a worst-case or most conservative estimate) across rollouts is more robust than only considering the final one.
The chart provides strong evidence that for this task, **PRM-Min-Sum** is the most effective and scalable aggregation technique among those compared, with **PRM-Last-Sum** as a very close second. The **PRM-Last-Max** technique is the least effective.