## Line Chart: Performance of Different PRM Aggregation Techniques
### Overview
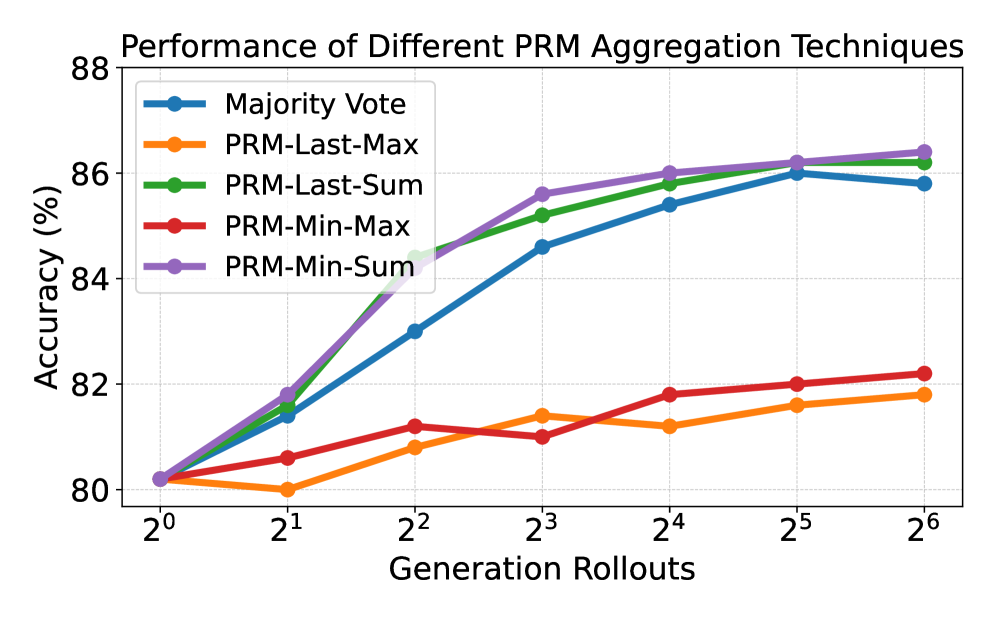
The chart compares the accuracy (%) of five PRM (Probabilistic Risk Management) aggregation techniques across six generation rollouts (2⁰ to 2⁶). Accuracy is measured on the y-axis (80–88%), while the x-axis represents exponential growth in generation rollouts. Five distinct lines represent different aggregation methods, with performance trends varying significantly.
---
### Components/Axes
- **X-Axis (Generation Rollouts)**: Labeled with powers of 2 (2⁰ to 2⁶), indicating exponential progression.
- **Y-Axis (Accuracy %)**: Ranges from 80% to 88%, with gridlines at 2% intervals.
- **Legend**: Positioned in the top-right corner, mapping colors to techniques:
- Blue: Majority Vote
- Orange: PRM-Last-Max
- Green: PRM-Last-Sum
- Red: PRM-Min-Max
- Purple: PRM-Min-Sum
---
### Detailed Analysis
1. **Majority Vote (Blue)**:
- Starts at 80% (2⁰) and increases steadily.
- Reaches ~86% at 2⁶, showing consistent improvement.
- Slope: Linear upward trend.
2. **PRM-Last-Max (Orange)**:
- Begins at 80% (2⁰), dips slightly at 2¹ (~79.8%), then rises.
- Peaks at ~82% at 2⁶.
- Slope: Gradual upward trend with minor fluctuations.
3. **PRM-Last-Sum (Green)**:
- Starts at 80% (2⁰), rises sharply to ~85% by 2³.
- Plateaus near 86% at 2⁶.
- Slope: Steep initial growth, then stabilizes.
4. **PRM-Min-Max (Red)**:
- Begins at 80% (2⁰), increases gradually to ~82% at 2⁶.
- Slope: Slow, linear upward trend.
5. **PRM-Min-Sum (Purple)**:
- Starts at 80% (2⁰), surges to ~86.5% by 2³.
- Maintains ~86.5% accuracy through 2⁶.
- Slope: Rapid initial growth, then plateaus.
---
### Key Observations
- **Top Performers**: PRM-Min-Sum (purple) and PRM-Last-Sum (green) achieve the highest accuracy (~86–86.5%) by 2⁶.
- **Dip Anomaly**: PRM-Last-Max (orange) shows a temporary drop at 2² (~80.5%) before recovering.
- **Consistency**: Majority Vote (blue) and PRM-Min-Max (red) exhibit steady but slower growth.
- **Exponential Scaling**: All techniques improve as generation rollouts increase, but PRM-Min-Sum and PRM-Last-Sum outperform others significantly.
---
### Interpretation
The data suggests that **PRM-Min-Sum** and **PRM-Last-Sum** are the most effective aggregation techniques for maximizing accuracy across generations. Their rapid initial improvement and plateau at high accuracy levels indicate robustness in scaling. In contrast, **PRM-Last-Max** and **PRM-Min-Max** lag behind, with the former showing a notable dip at 2² that may reflect instability in intermediate generations. The **Majority Vote** method, while reliable, underperforms compared to PRM-based techniques. The exponential growth in generation rollouts correlates with improved performance, emphasizing the importance of iterative refinement in PRM systems. The anomaly in PRM-Last-Max warrants further investigation into its behavior during transitional phases.