## Diagram: Silver Bromide Electrochemical Cell
### Overview
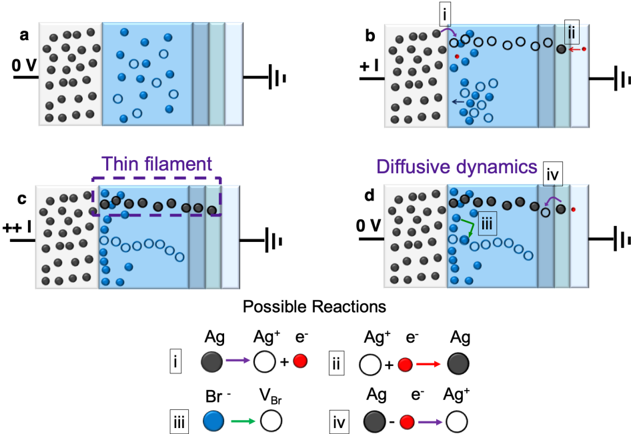
The image depicts a schematic representation of a silver bromide (AgBr) electrochemical cell under different voltage conditions, illustrating the movement of ions and the formation/dissolution of a silver filament. The diagram is divided into four sub-figures (a, b, c, d) showing the cell's state at different applied voltages, and a legend explaining the reactions.
### Components/Axes
* **Sub-figures:** a, b, c, d
* **Voltage Labels:** 0 V, +I, ++I
* **Cell Components:**
* Left Electrode: Represented by a gray block filled with black circles (Ag atoms).
* Electrolyte: Represented by a light blue region containing blue circles (Br- ions) and white circles (Ag+ ions).
* Right Electrode: Represented by a series of light gray blocks connected to a voltage source.
* **Legend:** Located at the bottom, explaining the reactions with numbered labels (i, ii, iii, iv).
* **Annotations:** "Thin filament", "Diffusive dynamics"
### Detailed Analysis or ### Content Details
**Sub-figure a (0 V):**
* The left electrode (Ag) contains a uniform distribution of black circles (Ag atoms).
* The electrolyte (AgBr) contains a mix of blue circles (Br- ions) and white circles (Ag+ ions), seemingly randomly distributed.
**Sub-figure b (+I):**
* Voltage: +I
* Reaction i: At the interface between the left electrode and the electrolyte, a black circle (Ag atom) transforms into a white circle (Ag+ ion) and a red circle (electron). The arrow indicates the direction of the reaction.
* Reaction ii: At the interface between the electrolyte and the right electrode, a white circle (Ag+ ion) combines with a red circle (electron) to form a black circle (Ag atom).
* White arrows indicate the movement of blue circles (Br- ions) towards the left electrode.
**Sub-figure c (++I):**
* Voltage: ++I (higher positive voltage than in b)
* A "Thin filament" of black circles (Ag atoms) is formed, extending from the left electrode towards the right electrode. This filament is enclosed in a dashed purple rectangle.
* The concentration of white circles (Ag+ ions) is higher near the right electrode.
* The concentration of blue circles (Br- ions) is higher near the left electrode.
**Sub-figure d (0 V):**
* Voltage: 0 V
* Annotation: "Diffusive dynamics"
* Reaction iii: A blue circle (Br- ion) transforms into a white circle (VBr, Bromine vacancy).
* Reaction iv: A black circle (Ag atom) combines with a red circle (electron) to form a white circle (Ag+ ion).
* The black circles (Ag atoms) in the filament are dissolving, and the white circles (Ag+ ions) are dispersing.
**Possible Reactions (Legend):**
* **Reaction i:** Ag (black circle) → Ag+ (white circle) + e- (red circle) (Silver atom becomes a silver ion and releases an electron)
* **Reaction ii:** Ag+ (white circle) + e- (red circle) → Ag (black circle) (Silver ion gains an electron and becomes a silver atom)
* **Reaction iii:** Br- (blue circle) → VBr (white circle) (Bromide ion becomes a bromine vacancy)
* **Reaction iv:** Ag (black circle) - e- (red circle) → Ag+ (white circle) (Silver atom loses an electron and becomes a silver ion)
### Key Observations
* The applied voltage influences the movement of ions and the formation of a silver filament.
* At higher voltages, a thin filament of silver forms, connecting the electrodes.
* When the voltage is removed, the filament dissolves due to diffusion and electrochemical reactions.
* The legend provides a key to understanding the reactions occurring at the electrode-electrolyte interfaces.
### Interpretation
The diagram illustrates the electrochemical processes involved in the formation and dissolution of a silver filament in a silver bromide cell. Applying a positive voltage causes silver ions to migrate towards the cathode (right electrode), where they are reduced to silver atoms, forming a conductive filament. When the voltage is removed, the filament dissolves as silver atoms oxidize back into silver ions, and bromine ions diffuse. This process is fundamental to resistive switching phenomena observed in memristive devices. The diagram effectively visualizes the ionic transport and redox reactions that govern the cell's behavior.