## Diagram: Electrochemical Reaction and Diffusion Dynamics
### Overview
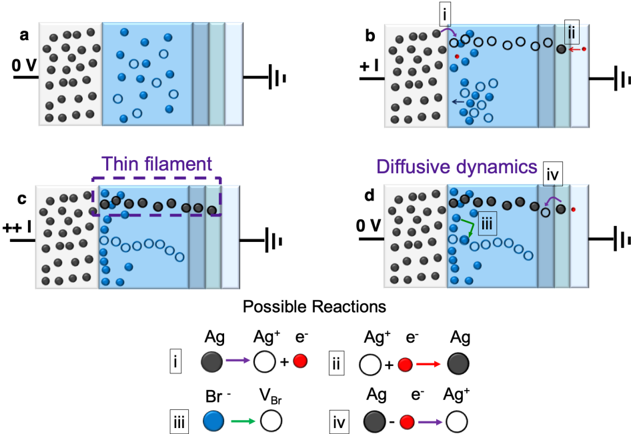
The diagram illustrates four panels (a-d) depicting electrochemical processes involving silver (Ag), bromide (Br⁻), and electron (e⁻) transfer. Panels show spatial arrangements of ions, electron flow, and reaction dynamics under varying potentials (0V and +1V). A legend at the bottom defines four reaction pathways with color-coded symbols.
### Components/Axes
- **Panels**:
- **a**: 0V potential, black dots (Ag), blue circles (Br⁻), and a vertical gradient (light blue to gray).
- **b**: +1V potential, black dots (Ag), blue circles (Br⁻), red arrows (electron flow), and a vertical gradient.
- **c**: Thin filament (purple dashed line), black dots (Ag), blue circles (Br⁻), and a vertical gradient.
- **d**: Diffusive dynamics, black dots (Ag), blue circles (Br⁻), red arrows (electron flow), and a vertical gradient.
- **Legend**:
- **i**: Ag → Ag⁺ + e⁻ (black dot → white circle + red dot).
- **ii**: Ag⁺ + e⁻ → Ag (white circle + red dot → black dot).
- **iii**: Br⁻ → V_Br (blue circle → white circle).
- **iv**: Ag⁺ + e⁻ → Ag⁺ (black dot + red dot → white circle).
- **Spatial Grounding**:
- Legend positioned at the bottom center.
- Panels arranged in a 2x2 grid (top-left: a, top-right: b, bottom-left: c, bottom-right: d).
- Reaction symbols (black, red, blue, purple) match panel elements.
### Detailed Analysis
- **Panel a**: Neutral (0V) conditions. Black dots (Ag) and blue circles (Br⁻) are uniformly distributed. No electron flow indicated.
- **Panel b**: +1V applied. Red arrows show electron flow from Ag to Br⁻. Reaction ii (Ag⁺ + e⁻ → Ag) occurs at the interface.
- **Panel c**: Thin filament separates Ag and Br⁻. Reaction iii (Br⁻ → V_Br) occurs near the filament.
- **Panel d**: Diffusive dynamics. Red arrows indicate electron flow, and blue circles (Br⁻) diffuse toward Ag⁺. Reaction iv (Ag⁺ + e⁻ → Ag⁺) is highlighted.
### Key Observations
1. **Reaction i (Ag → Ag⁺ + e⁻)**: Occurs in panel b, driven by +1V potential.
2. **Reaction ii (Ag⁺ + e⁻ → Ag)**: Dominates in panel b, reversing reaction i.
3. **Reaction iii (Br⁻ → V_Br)**: Localized near the thin filament in panel c.
4. **Reaction iv (Ag⁺ + e⁻ → Ag⁺)**: Occurs in panel d, suggesting electron transfer without net Ag reduction.
5. **Diffusion**: Panel d shows Br⁻ diffusion toward Ag⁺, driven by concentration gradients.
### Interpretation
The diagram models an electrochemical cell where:
- **Potential gradients** (0V to +1V) drive electron transfer between Ag and Br⁻.
- **Thin filaments** act as barriers, localizing specific reactions (e.g., Br⁻ oxidation in panel c).
- **Diffusion dynamics** (panel d) illustrate ion movement under electrochemical gradients, with reaction iv suggesting a catalytic or intermediate step.
- **Reaction reversibility** is evident in panels b and d, where electron flow direction determines Ag oxidation/reduction.
The system likely represents a redox process with competing reactions, where applied voltage and ion distribution govern the dominant pathway. The thin filament in panel c may represent a porous separator or catalyst, modulating ion/electron transport.