## Chart: Explained Variance over Training Steps
### Overview
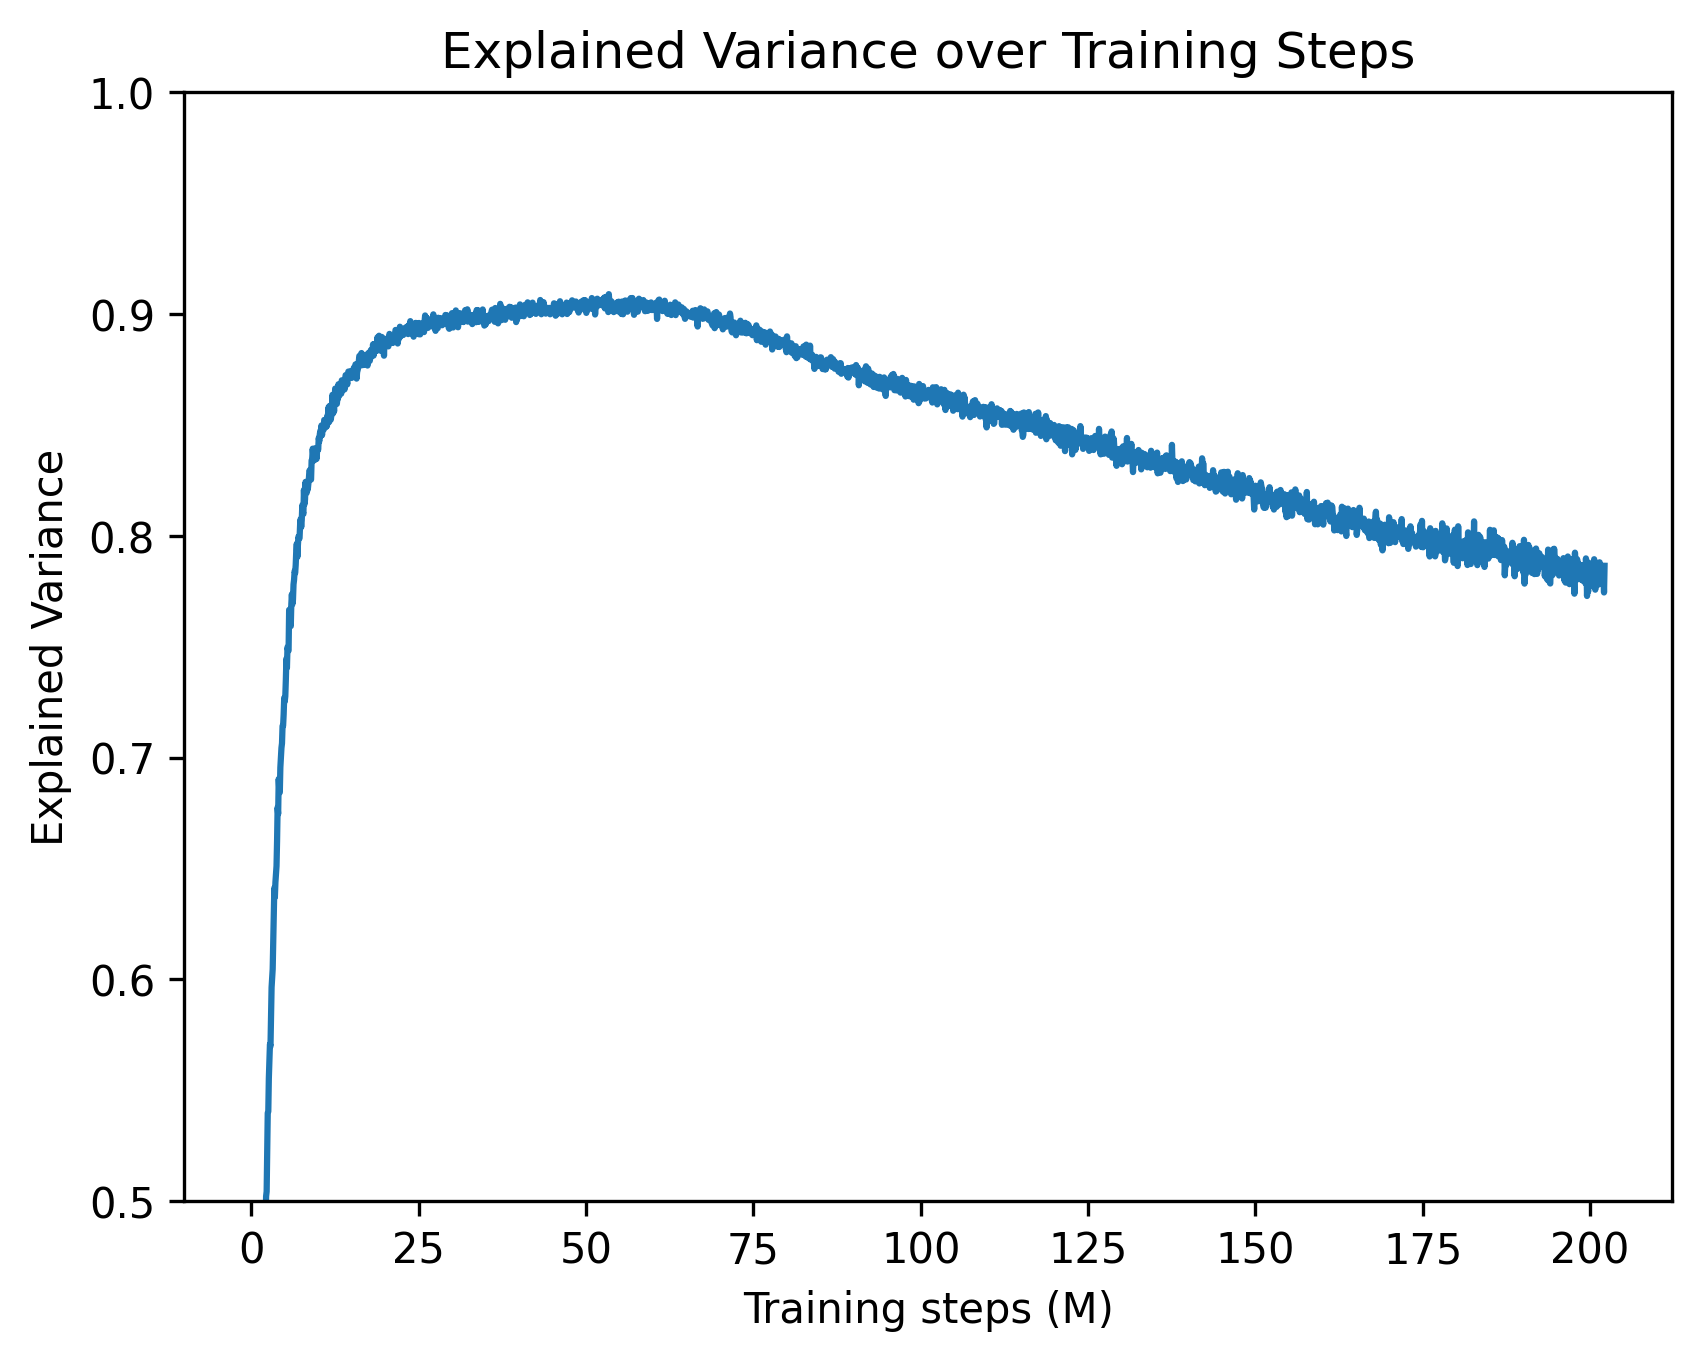
The image is a line chart showing the explained variance of a model over training steps. The x-axis represents the training steps in millions (M), ranging from 0 to 200. The y-axis represents the explained variance, ranging from 0.5 to 1.0. The chart shows how the explained variance changes as the model is trained.
### Components/Axes
* **Title:** Explained Variance over Training Steps
* **X-axis:** Training steps (M)
* Scale: 0 to 200, with markers at 0, 25, 50, 75, 100, 125, 150, 175, and 200.
* **Y-axis:** Explained Variance
* Scale: 0.5 to 1.0, with markers at 0.5, 0.6, 0.7, 0.8, 0.9, and 1.0.
* **Data Series:** A single blue line representing the explained variance.
### Detailed Analysis
The blue line represents the explained variance over training steps.
* **Initial Phase (0-50M):** The explained variance increases rapidly from approximately 0.5 to a peak of approximately 0.91.
* **Peak (around 50M):** The explained variance reaches its maximum value of approximately 0.91.
* **Decline Phase (50M-200M):** The explained variance gradually decreases from approximately 0.91 to approximately 0.78.
Specific data points (approximate):
* At 0M training steps, the explained variance is approximately 0.5.
* At 25M training steps, the explained variance is approximately 0.85.
* At 50M training steps, the explained variance is approximately 0.91.
* At 100M training steps, the explained variance is approximately 0.87.
* At 150M training steps, the explained variance is approximately 0.83.
* At 200M training steps, the explained variance is approximately 0.78.
### Key Observations
* The explained variance increases rapidly in the initial training phase.
* The explained variance peaks around 50 million training steps.
* After the peak, the explained variance gradually decreases as training continues.
### Interpretation
The chart suggests that the model initially learns quickly, as indicated by the rapid increase in explained variance. However, after a certain point (around 50 million training steps), further training leads to a decrease in explained variance, which could indicate overfitting. The model may be starting to memorize the training data rather than generalizing to new data. This suggests that the optimal number of training steps for this model is around 50 million. Further training beyond this point may not be beneficial and could even be detrimental to the model's performance on unseen data.