## Line Chart: Explained Variance over Training Steps
### Overview
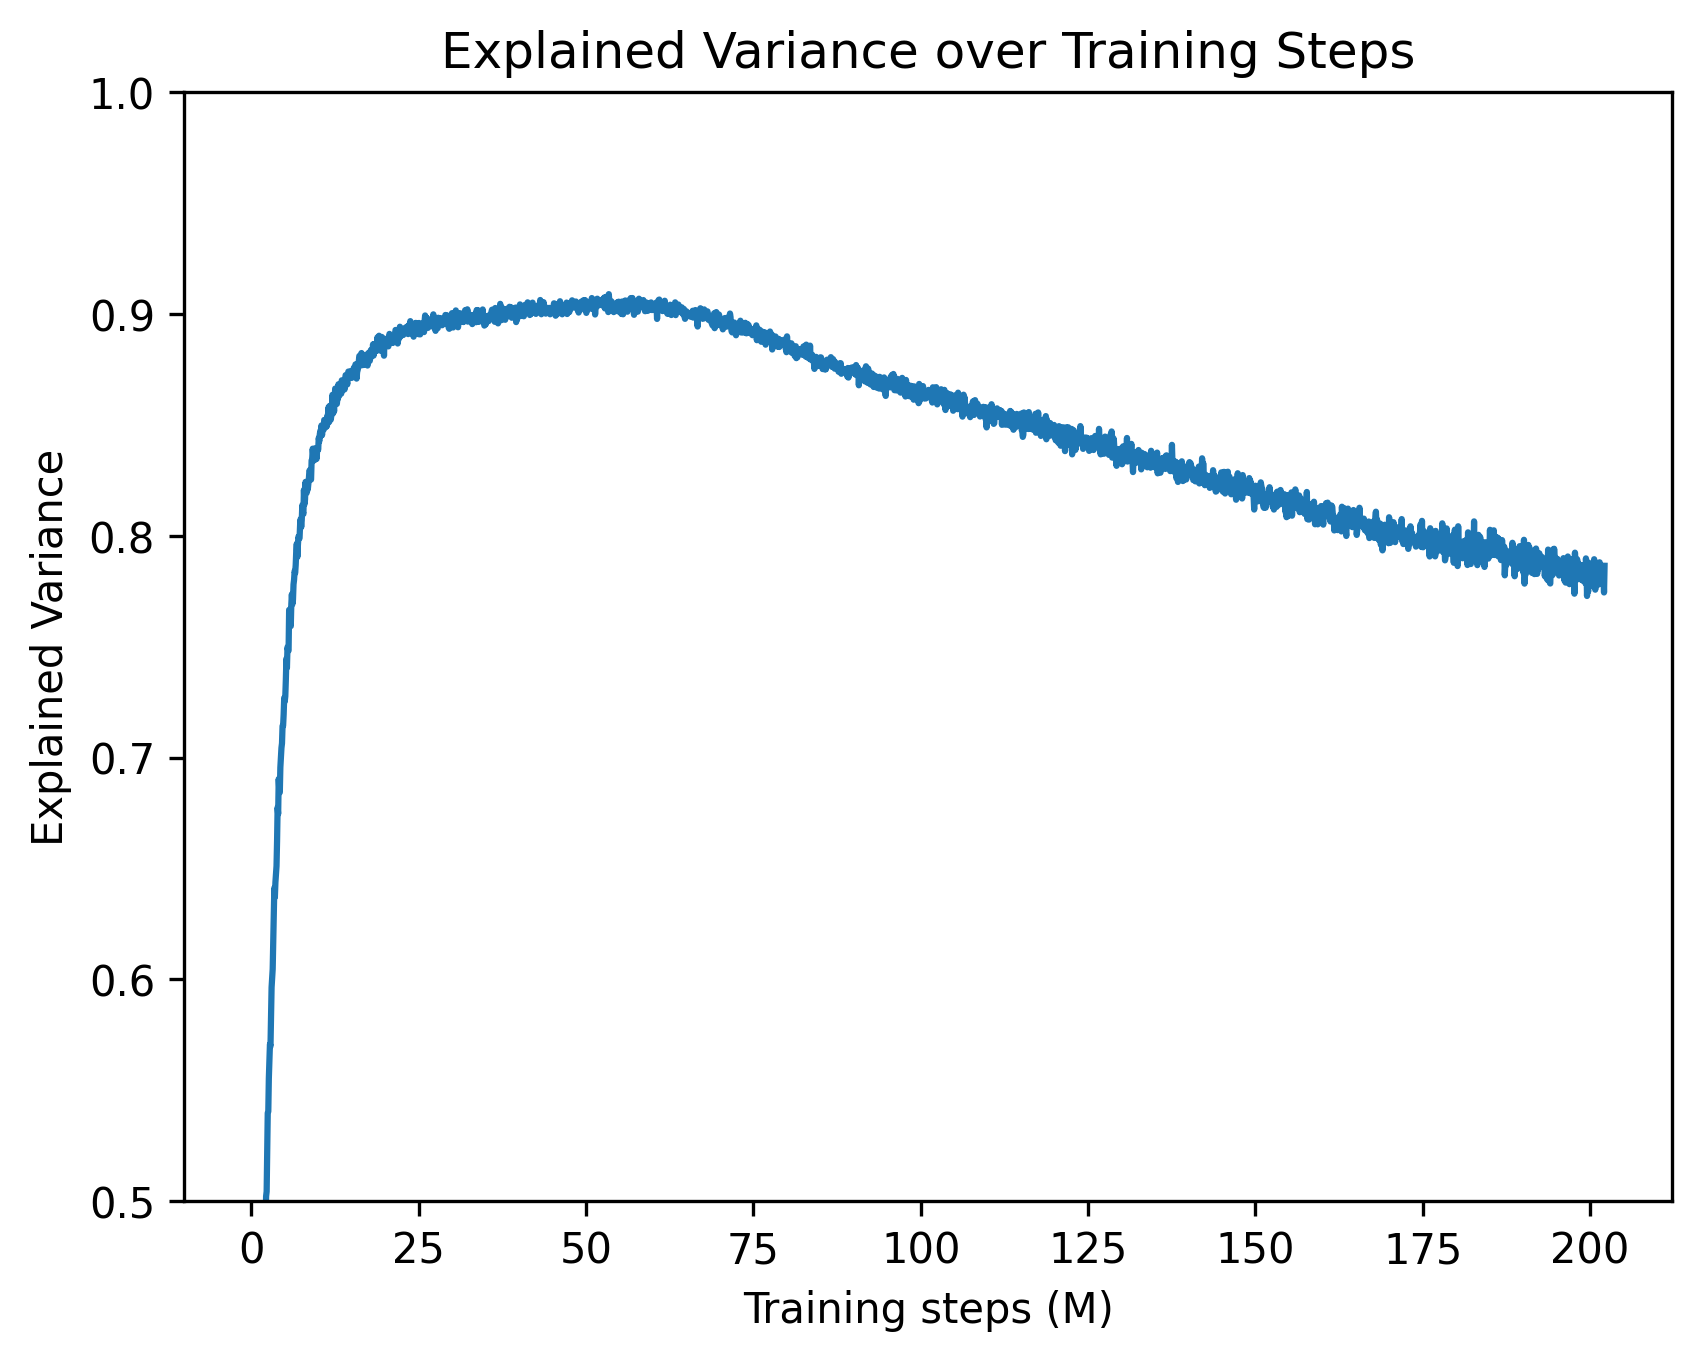
The image is a two-dimensional line chart illustrating the trajectory of a machine learning metric, "Explained Variance," over a duration measured in "Training steps (M)". The chart features a single, unlabelled data series represented by a solid blue line. The language used in the chart is entirely English.
### Components/Axes
**Header Region:**
* **Title:** "Explained Variance over Training Steps" (Positioned at the top center).
**Main Chart Region:**
* **Data Series:** A single blue line plotting the relationship between the X and Y axes. There is no legend present, implying only one model or run is being evaluated.
**Y-Axis (Left side, vertical):**
* **Label:** "Explained Variance" (Rotated 90 degrees counter-clockwise).
* **Scale:** Linear, ranging from 0.5 to 1.0.
* **Markers (Tick marks):** 0.5, 0.6, 0.7, 0.8, 0.9, 1.0.
**X-Axis (Bottom, horizontal):**
* **Label:** "Training steps (M)" (Positioned below the axis markers). The "(M)" conventionally denotes "Millions".
* **Scale:** Linear, ranging from 0 to slightly past 200.
* **Markers (Tick marks):** 0, 25, 50, 75, 100, 125, 150, 175, 200.
### Detailed Analysis
**Trend Verification:**
The blue line exhibits three distinct phases:
1. A rapid, near-vertical ascent from the start.
2. A gentle curve leading to a rounded peak.
3. A long, steady, linear decline characterized by high-frequency, low-amplitude noise (visible as "fuzziness" on the line).
**Data Point Extraction (Approximate values with ±0.01 uncertainty):**
* **Start (x=0):** The line originates below the visible Y-axis minimum of 0.5.
* **x ≈ 2.5:** The line crosses the Y=0.5 threshold.
* **x = 10:** The line has risen sharply to approximately Y=0.82.
* **x = 25:** The rate of increase slows significantly, reaching approximately Y=0.89.
* **x = 50:** The line reaches its global maximum (peak) at approximately Y=0.90 to 0.91.
* **x = 75:** The line begins its gradual decline, sitting at approximately Y=0.89.
* **x = 100:** The downward trend continues, reaching approximately Y=0.86.
* **x = 125:** The value drops to approximately Y=0.84.
* **x = 150:** The value drops to approximately Y=0.82.
* **x = 175:** The value drops to approximately Y=0.80.
* **x = 200:** The line ends at approximately Y=0.78.
### Key Observations
* **Asymmetry:** The rate of learning (ascent) is vastly faster than the rate of degradation (descent). The model achieves 90% of its peak performance within the first 10% of the training timeline.
* **Peak Performance:** The optimal point for this specific metric occurs around 50 million training steps.
* **Signal Noise:** The line is not perfectly smooth, particularly during the descent phase (from 50M to 200M steps). This micro-variance indicates step-to-step fluctuations inherent in the training process (e.g., mini-batch sampling noise).
### Interpretation
This chart displays a classic machine learning training dynamic, likely from a deep learning or reinforcement learning context.
* **The Metric:** "Explained Variance" measures the proportion of mathematical variance in a dataset that is accounted for by the model. A value of 1.0 indicates perfect prediction/explanation. Reaching ~0.90 indicates a highly effective model at that specific point in time.
* **Initial Phase (0 - 25M steps):** The model rapidly learns the underlying patterns of the data or environment. The steepness suggests the initial gradients are highly informative.
* **The Decline (50M - 200M steps):** The steady drop in explained variance after 50 million steps is a strong indicator of **overfitting** or **representation degradation**.
* If this is evaluated on a *validation set*, the model is beginning to memorize the training data at the expense of generalization.
* If this is a Reinforcement Learning scenario (where Explained Variance is often used to evaluate the Value Function), the policy may be changing in a way that makes the environment harder to predict, or the network is suffering from catastrophic forgetting as it updates over too many steps.
* **Actionable Insight:** Based on this chart, a practitioner would likely employ "Early Stopping" around 40M to 60M steps to capture the model at its peak explanatory power, as continuing to train up to 200M steps results in a net loss of performance (dropping back down to levels seen at just 8M steps).