## Line Graph: Explained Variance over Training Steps
### Overview
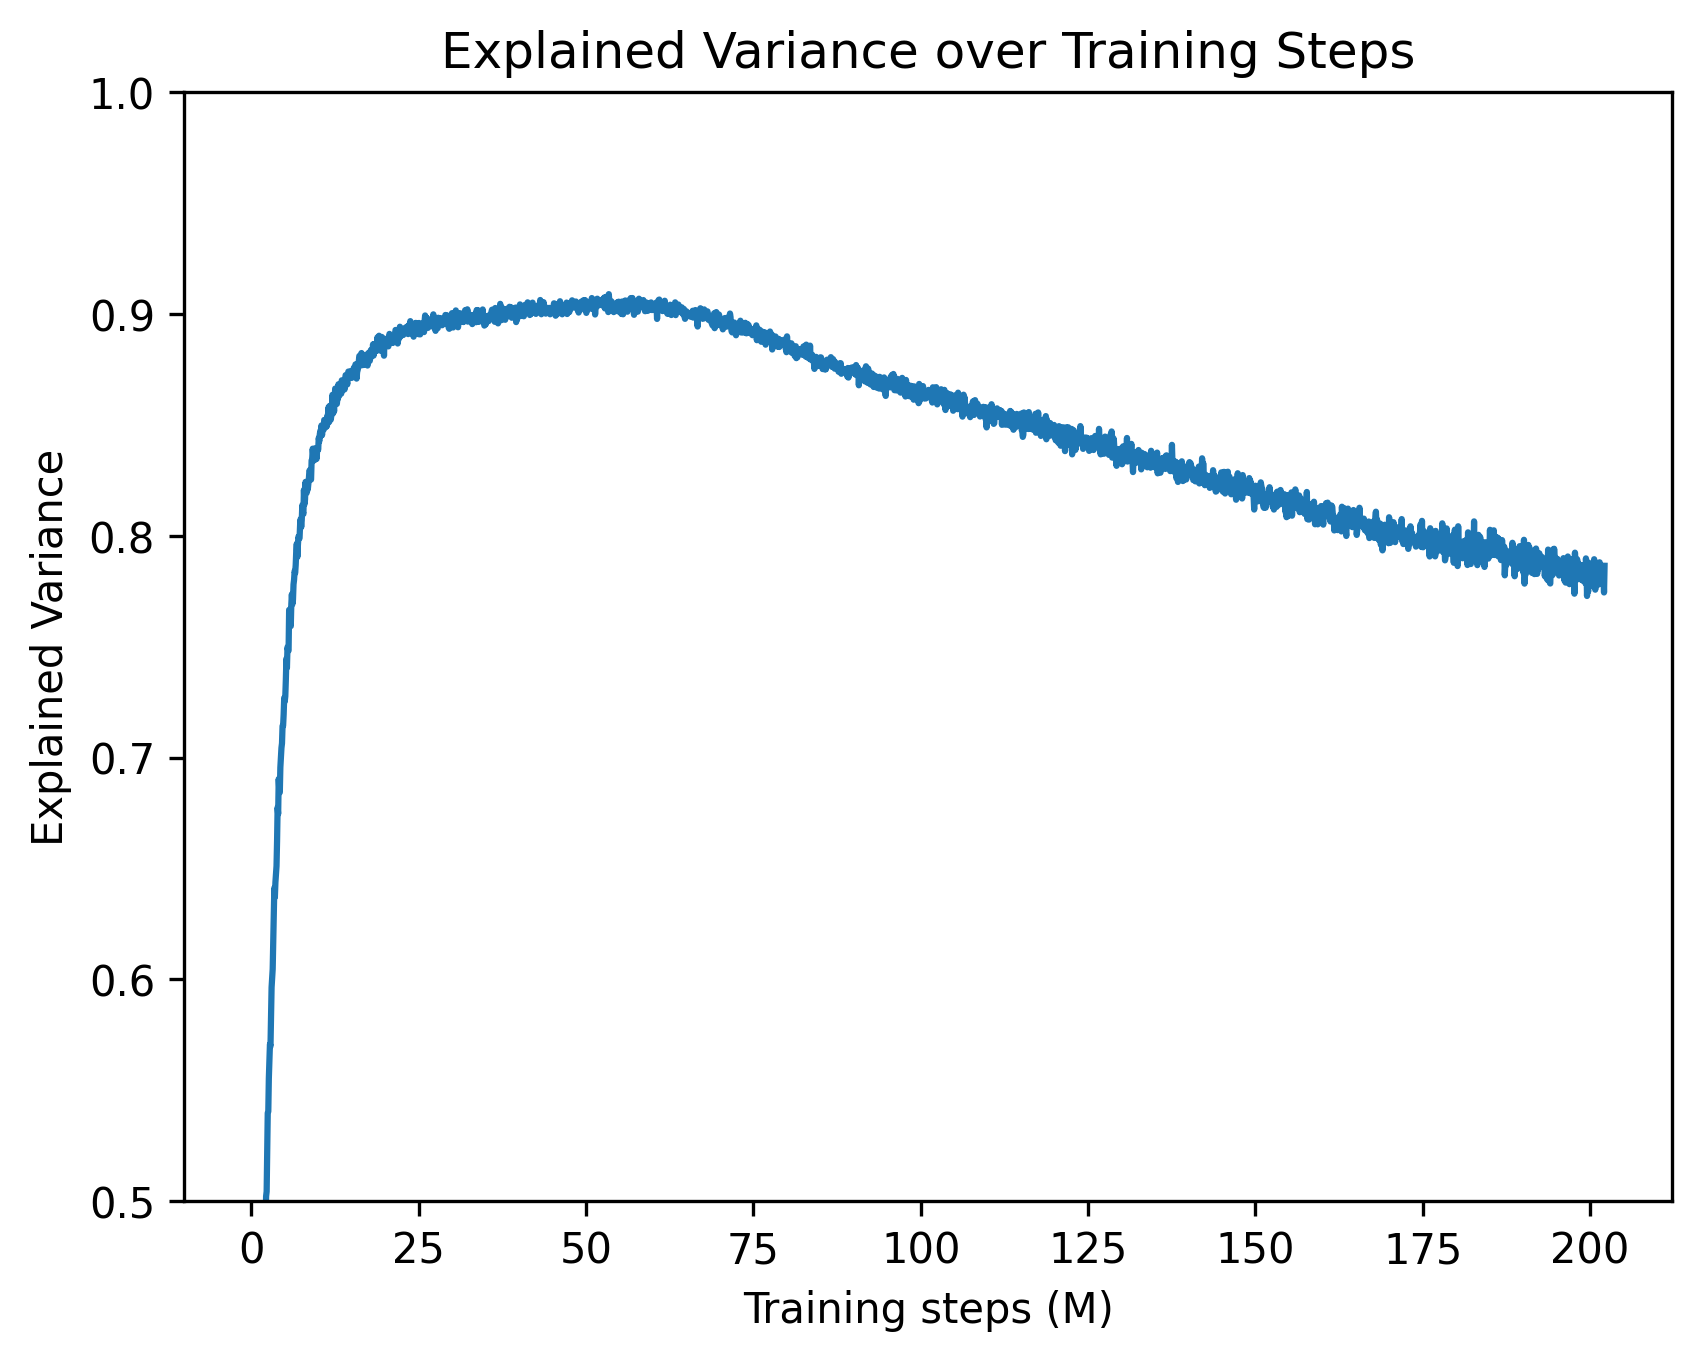
The graph depicts the relationship between training steps (in millions) and explained variance, showing a rapid initial increase, a plateau phase, and a gradual decline. The y-axis ranges from 0.5 to 1.0, while the x-axis spans 0 to 200 million training steps.
### Components/Axes
- **X-axis (Training steps (M))**: Labeled with increments of 25 million (0, 25, 50, ..., 200).
- **Y-axis (Explained Variance)**: Labeled with increments of 0.1 (0.5, 0.6, ..., 1.0).
- **Legend**: Not visible in the image.
- **Line**: Single blue line representing explained variance over training steps.
### Detailed Analysis
- **Initial Rise (0–50M steps)**:
- At 0 steps: Explained variance ≈ 0.5.
- By 25M steps: Rapidly increases to ≈ 0.88.
- By 50M steps: Peaks at ≈ 0.90.
- **Plateau Phase (50–75M steps)**:
- Remains stable at ≈ 0.90 between 50M and 75M steps.
- **Gradual Decline (75M–200M steps)**:
- At 100M steps: ≈ 0.87.
- At 125M steps: ≈ 0.85.
- At 150M steps: ≈ 0.83.
- At 175M steps: ≈ 0.81.
- At 200M steps: ≈ 0.78.
### Key Observations
1. **Rapid Initial Improvement**: Explained variance increases sharply in the first 50M steps, suggesting strong early learning.
2. **Plateau**: Performance stabilizes between 50M and 75M steps, indicating diminishing returns.
3. **Decline**: A consistent downward trend after 75M steps, with a total drop of ~0.12 (from 0.90 to 0.78).
4. **No Outliers**: The line is smooth, with no abrupt fluctuations.
### Interpretation
The graph suggests that the model’s ability to explain variance improves significantly during early training but plateaus and eventually degrades over time. This could indicate:
- **Overfitting**: The model may have memorized training data, reducing generalization.
- **Diminishing Returns**: Further training beyond 75M steps yields minimal gains.
- **Capacity Limits**: The model may have reached its maximum explanatory power, necessitating architectural changes or more data.
The absence of a legend implies a single data series, and the blue line’s consistent trend aligns with the observed patterns. The decline after 75M steps warrants further investigation into training dynamics or dataset characteristics.