TECHNICAL ASSET FINGERPRINT
a49d50e890776cf7df349711
Click to view fullscreen
Press ESC or click to close
FOUND IN PAPERS
EXPERT: gemini-2.0-flash VERSION 1
RUNTIME: nugit/gemini/gemini-2.0-flash
INTEL_VERIFIED
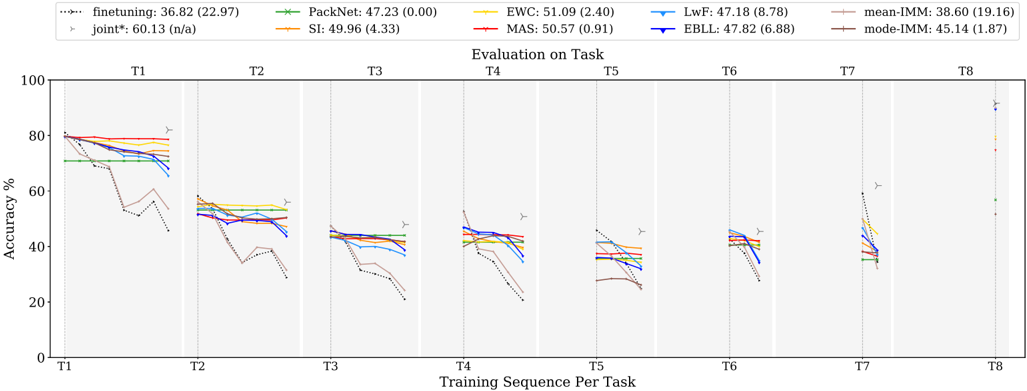
## Line Chart: Evaluation on Task
### Overview
The image is a line chart comparing the performance of different continual learning algorithms across a sequence of tasks (T1 to T8). The y-axis represents accuracy percentage, and the x-axis represents the training sequence per task. Each line represents a different algorithm, and the chart shows how the accuracy of each algorithm changes as it is trained on subsequent tasks.
### Components/Axes
* **Title:** Evaluation on Task
* **X-axis:** Training Sequence Per Task (T1, T2, T3, T4, T5, T6, T7, T8)
* **Y-axis:** Accuracy % (Scale: 0 to 100)
* **Legend (Top-Left):**
* finetuning: 36.82 (22.97) - Dotted Black Line
* joint*: 60.13 (n/a) - Gray Line with Triangle Markers
* PackNet: 47.23 (0.00) - Green Line with X Markers
* SI: 49.96 (4.33) - Orange Line
* EWC: 51.09 (2.40) - Yellow Line
* MAS: 50.57 (0.91) - Red Line
* LwF: 47.18 (8.78) - Light Blue Line
* EBLL: 47.82 (6.88) - Dark Blue Line
* mean-IMM: 38.60 (19.16) - Light Brown Line
* mode-IMM: 45.14 (1.87) - Dark Brown Line
### Detailed Analysis
**Task 1 (T1):**
* finetuning (Dotted Black): Starts at approximately 78% and drops sharply to around 52%.
* joint* (Gray w/ Triangles): Starts at approximately 82% and remains relatively stable.
* PackNet (Green w/ X): Starts at approximately 72% and remains relatively stable.
* SI (Orange): Starts at approximately 80% and remains relatively stable.
* EWC (Yellow): Starts at approximately 78% and remains relatively stable.
* MAS (Red): Starts at approximately 80% and remains relatively stable.
* LwF (Light Blue): Starts at approximately 74% and remains relatively stable.
* EBLL (Dark Blue): Starts at approximately 76% and remains relatively stable.
* mean-IMM (Light Brown): Starts at approximately 70% and remains relatively stable.
* mode-IMM (Dark Brown): Starts at approximately 78% and remains relatively stable.
**Task 2 (T2):**
* finetuning (Dotted Black): Decreases to approximately 35%.
* joint* (Gray w/ Triangles): Remains relatively stable at approximately 58%.
* PackNet (Green w/ X): Remains relatively stable at approximately 52%.
* SI (Orange): Remains relatively stable at approximately 54%.
* EWC (Yellow): Remains relatively stable at approximately 55%.
* MAS (Red): Remains relatively stable at approximately 52%.
* LwF (Light Blue): Remains relatively stable at approximately 50%.
* EBLL (Dark Blue): Remains relatively stable at approximately 52%.
* mean-IMM (Light Brown): Remains relatively stable at approximately 50%.
* mode-IMM (Dark Brown): Remains relatively stable at approximately 55%.
**Task 3 (T3):**
* finetuning (Dotted Black): Decreases to approximately 32%.
* joint* (Gray w/ Triangles): Remains relatively stable at approximately 56%.
* PackNet (Green w/ X): Remains relatively stable at approximately 48%.
* SI (Orange): Remains relatively stable at approximately 48%.
* EWC (Yellow): Remains relatively stable at approximately 48%.
* MAS (Red): Remains relatively stable at approximately 46%.
* LwF (Light Blue): Remains relatively stable at approximately 44%.
* EBLL (Dark Blue): Remains relatively stable at approximately 46%.
* mean-IMM (Light Brown): Remains relatively stable at approximately 42%.
* mode-IMM (Dark Brown): Remains relatively stable at approximately 46%.
**Task 4 (T4):**
* finetuning (Dotted Black): Decreases to approximately 30%.
* joint* (Gray w/ Triangles): Remains relatively stable at approximately 54%.
* PackNet (Green w/ X): Remains relatively stable at approximately 46%.
* SI (Orange): Remains relatively stable at approximately 46%.
* EWC (Yellow): Remains relatively stable at approximately 46%.
* MAS (Red): Remains relatively stable at approximately 44%.
* LwF (Light Blue): Remains relatively stable at approximately 42%.
* EBLL (Dark Blue): Remains relatively stable at approximately 44%.
* mean-IMM (Light Brown): Remains relatively stable at approximately 38%.
* mode-IMM (Dark Brown): Remains relatively stable at approximately 44%.
**Task 5 (T5):**
* finetuning (Dotted Black): Decreases to approximately 28%.
* joint* (Gray w/ Triangles): Remains relatively stable at approximately 52%.
* PackNet (Green w/ X): Remains relatively stable at approximately 44%.
* SI (Orange): Remains relatively stable at approximately 44%.
* EWC (Yellow): Remains relatively stable at approximately 44%.
* MAS (Red): Remains relatively stable at approximately 42%.
* LwF (Light Blue): Remains relatively stable at approximately 40%.
* EBLL (Dark Blue): Remains relatively stable at approximately 42%.
* mean-IMM (Light Brown): Remains relatively stable at approximately 34%.
* mode-IMM (Dark Brown): Remains relatively stable at approximately 42%.
**Task 6 (T6):**
* finetuning (Dotted Black): Decreases to approximately 26%.
* joint* (Gray w/ Triangles): Remains relatively stable at approximately 50%.
* PackNet (Green w/ X): Remains relatively stable at approximately 42%.
* SI (Orange): Remains relatively stable at approximately 42%.
* EWC (Yellow): Remains relatively stable at approximately 42%.
* MAS (Red): Remains relatively stable at approximately 40%.
* LwF (Light Blue): Remains relatively stable at approximately 38%.
* EBLL (Dark Blue): Remains relatively stable at approximately 40%.
* mean-IMM (Light Brown): Remains relatively stable at approximately 32%.
* mode-IMM (Dark Brown): Remains relatively stable at approximately 40%.
**Task 7 (T7):**
* finetuning (Dotted Black): Decreases to approximately 24%.
* joint* (Gray w/ Triangles): Remains relatively stable at approximately 62%.
* PackNet (Green w/ X): Remains relatively stable at approximately 38%.
* SI (Orange): Remains relatively stable at approximately 38%.
* EWC (Yellow): Remains relatively stable at approximately 40%.
* MAS (Red): Remains relatively stable at approximately 38%.
* LwF (Light Blue): Remains relatively stable at approximately 36%.
* EBLL (Dark Blue): Remains relatively stable at approximately 38%.
* mean-IMM (Light Brown): Remains relatively stable at approximately 30%.
* mode-IMM (Dark Brown): Remains relatively stable at approximately 38%.
**Task 8 (T8):**
* finetuning (Dotted Black): Increases to approximately 92%.
* joint* (Gray w/ Triangles): Remains relatively stable at approximately 92%.
* PackNet (Green w/ X): Remains relatively stable at approximately 58%.
* SI (Orange): Remains relatively stable at approximately 58%.
* EWC (Yellow): Remains relatively stable at approximately 92%.
* MAS (Red): Remains relatively stable at approximately 92%.
* LwF (Light Blue): Remains relatively stable at approximately 92%.
* EBLL (Dark Blue): Remains relatively stable at approximately 92%.
* mean-IMM (Light Brown): Remains relatively stable at approximately 58%.
* mode-IMM (Dark Brown): Remains relatively stable at approximately 58%.
### Key Observations
* The "finetuning" algorithm (dotted black line) experiences a significant drop in accuracy after the first task and remains low for subsequent tasks until Task 8 where it spikes.
* The "joint*" algorithm (gray line with triangle markers) maintains a relatively stable and higher accuracy compared to other algorithms across all tasks, except for Task 8 where most algorithms perform similarly.
* Other algorithms (PackNet, SI, EWC, MAS, LwF, EBLL, mean-IMM, mode-IMM) show a gradual decrease in accuracy as the task sequence progresses, but they perform better than "finetuning" in tasks T2-T7.
* In Task 8, most algorithms show a significant increase in accuracy, suggesting a potential change or reset in the task setup.
### Interpretation
The chart illustrates the challenge of continual learning, where models struggle to maintain performance on previously learned tasks as they are trained on new ones. The "finetuning" algorithm suffers from catastrophic forgetting, as its accuracy drops significantly after the first task. The "joint*" algorithm, likely trained on all tasks simultaneously, provides a performance upper bound and demonstrates the potential accuracy achievable without forgetting. The other algorithms represent various strategies to mitigate forgetting, and their performance reflects the effectiveness of these strategies. The spike in accuracy for most algorithms in Task 8 suggests that this task might be significantly different or easier than the preceding tasks, or that some form of reset or adaptation occurs at this point.
DECODING INTELLIGENCE...
EXPERT: gemini-3.1-flash-lite-preview-free VERSION 1
RUNTIME: google-free/gemini-3.1-flash-lite-preview
INTEL_VERIFIED
## Line Chart: Continual Learning Model Performance Evaluation
### Overview
This image displays a performance evaluation chart for various machine learning models in a "continual learning" context. The chart tracks the accuracy of models on specific tasks (T1 through T8) as the models continue to train on subsequent tasks. The downward slope of the lines within each task block illustrates "catastrophic forgetting," where a model's performance on previously learned tasks degrades as it learns new ones.
### Components/Axes
* **Y-Axis:** "Accuracy %", ranging from 0 to 100.
* **X-Axis:** "Training Sequence Per Task", divided into 8 distinct vertical regions labeled T1 through T8.
* **Legend:** Positioned at the top of the chart. It lists the methods, their average accuracy, and standard deviation (in parentheses).
* **finetuning**: Dotted black line. (36.82 ± 22.97)
* **joint\***: Grey triangle marker (appears only at T8). (60.13 ± n/a)
* **PackNet**: Green line with 'x' markers. (47.23 ± 0.00)
* **SI**: Orange line with '+' markers. (49.96 ± 4.33)
* **EWC**: Yellow line. (51.09 ± 2.40)
* **MAS**: Red line. (50.57 ± 0.91)
* **LwF**: Light blue line. (47.18 ± 8.78)
* **EBLL**: Dark blue line with triangle markers. (47.82 ± 6.88)
* **mean-IMM**: Light brown/tan line. (38.60 ± 19.16)
* **mode-IMM**: Dark brown line. (45.14 ± 1.87)
### Detailed Analysis
The chart is segmented into 8 vertical panels (T1–T8). Each panel represents the accuracy of the models on that specific task as the training progresses through the sequence.
* **T1 Panel:** All models begin with high accuracy (~80%). The `finetuning` (dotted black) line shows the steepest decline, dropping to ~45%. `PackNet` (green) remains nearly flat at ~70%.
* **T2 Panel:** Models start at ~50–55%. `finetuning` drops sharply to ~30%. `PackNet` remains stable at ~55%.
* **T3 Panel:** Models start at ~45%. `finetuning` drops to ~20%. Other models cluster between 30% and 45%.
* **T4 Panel:** Models start at ~45–50%. `finetuning` drops to ~20%.
* **T5 Panel:** Models start at ~35–45%.
* **T6 Panel:** Models start at ~40–45%.
* **T7 Panel:** Models start at ~45–60%.
* **T8 Panel:** This column acts as a summary of final performance. The `joint*` method (grey triangle) is the clear outlier at the top (~90%), representing the theoretical upper bound (training on all data simultaneously). `finetuning` is at the bottom.
### Key Observations
* **Catastrophic Forgetting:** The `finetuning` method (dotted black line) consistently exhibits the most severe performance degradation across all tasks, confirming it is the most susceptible to forgetting previous information.
* **Stability vs. Plasticity:** `PackNet` (green line) demonstrates the highest stability (the line is almost horizontal), indicating it effectively preserves knowledge of previous tasks, though its starting accuracy is lower than other methods.
* **Performance Gap:** There is a significant performance gap between the `joint*` method (the oracle) and the continual learning methods, particularly in later tasks.
* **Method Clustering:** Most regularization-based methods (EWC, MAS, SI, EBLL) cluster together in the middle of the performance range, showing moderate forgetting.
### Interpretation
This chart demonstrates the fundamental challenge of Continual Learning: balancing the ability to learn new tasks (plasticity) with the ability to retain knowledge of old tasks (stability).
* **The "Finetuning" Baseline:** The steep downward slope of the `finetuning` line is the benchmark for "catastrophic forgetting." It shows that without specific mechanisms to protect old knowledge, neural networks quickly overwrite previous weights with new information.
* **The "Joint" Oracle:** The `joint*` marker at T8 represents the "upper bound" of performance. It is the accuracy achievable if the model had access to all data from all tasks simultaneously. The distance between the other methods and this `joint*` point quantifies the "forgetting" penalty of each approach.
* **Architectural vs. Regularization:** The flat line of `PackNet` suggests an architectural approach (likely parameter isolation or masking) that is highly effective at preventing interference between tasks, whereas the other methods (EWC, MAS, etc.) are likely regularization-based, which struggle more to maintain performance over long sequences.
DECODING INTELLIGENCE...
EXPERT: nemotron-free VERSION 1
RUNTIME: free/nvidia/nemotron-nano-12b-v2-vl:free
INTEL_VERIFIED
## Line Graph: Evaluation on Task Accuracy Across Training Sequences
### Overview
The image is a multi-line graph comparing the accuracy performance of various machine learning methods across eight training tasks (T1-T8). The y-axis represents accuracy percentage (0-100%), while the x-axis shows sequential training tasks. The graph includes eight distinct data series representing different model configurations, with a legend at the top providing method names, colors, and performance metrics.
### Components/Axes
- **X-axis**: "Training Sequence Per Task" labeled with tasks T1 through T8
- **Y-axis**: "Accuracy %" scaled from 0 to 100
- **Legend**: Located at the top with 8 entries:
1. finetuning: 36.82 (22.97) - black dotted line
2. PackNet: 47.23 (0.00) - green star line
3. EWC: 51.09 (2.40) - yellow line
4. MAS: 50.57 (0.91) - red line
5. LwF: 47.18 (8.78) - blue line
6. EBLL: 47.82 (6.88) - dark blue line
7. mean-IMM: 38.60 (19.16) - light brown dashed line
8. mode-IMM: 45.14 (1.87) - dark brown dashed line
- **Additional Elements**:
- Vertical gray lines separating task boundaries
- Yellow triangle markers at task boundaries
- Vertical dashed lines at task boundaries
- "joint*": 60.13 (n/a) - gray triangle marker
### Detailed Analysis
1. **Finetuning** (black dotted line):
- Starts at ~80% on T1
- Sharp decline to ~40% by T3
- Fluctuates between 30-50% through T8
- Final value: 36.82% (22.97 uncertainty)
2. **PackNet** (green star line):
- Maintains ~47% accuracy across all tasks
- Minimal variation (0.00 uncertainty)
- Consistent performance with slight dip at T7
3. **EWC** (yellow line):
- Peaks at ~51% on T1
- Gradual decline to ~40% by T8
- Moderate stability with 2.40 uncertainty
4. **MAS** (red line):
- Starts at ~50% on T1
- Slight decline to ~45% by T8
- Very stable with 0.91 uncertainty
5. **LwF** (blue line):
- Begins at ~47% on T1
- Sharp drop to ~30% by T3
- Recovers to ~40% by T8
- High variability (8.78 uncertainty)
6. **EBLL** (dark blue line):
- Starts at ~48% on T1
- Gradual decline to ~40% by T8
- Moderate stability (6.88 uncertainty)
7. **mean-IMM** (light brown dashed line):
- Starts at ~38% on T1
- Sharp decline to ~20% by T3
- Recovers to ~30% by T8
- High variability (19.16 uncertainty)
8. **mode-IMM** (dark brown dashed line):
- Starts at ~45% on T1
- Gradual decline to ~35% by T8
- Most stable with 1.87 uncertainty
### Key Observations
1. **Performance Variance**:
- EWC shows highest initial performance (51.09%) but declines over time
- PackNet maintains most consistent performance (47.23% ±0.00)
- Finetuning has highest initial accuracy (80%) but largest drop-off
2. **Task-Specific Patterns**:
- T1 shows highest overall performance across methods
- T8 has most significant performance drops for most methods
- Joint* method (gray triangle) shows highest performance at T8 (60.13%)
3. **Uncertainty Patterns**:
- Finetuning has highest uncertainty (22.97)
- PackNet has perfect certainty (0.00)
- MAS shows lowest uncertainty (0.91)
### Interpretation
The data demonstrates significant variability in model performance across training tasks. PackNet's perfect certainty and consistent performance suggest superior stability, while finetuning's high initial accuracy but large uncertainty indicates potential overfitting. The joint* method's superior T8 performance (60.13%) suggests effective long-term adaptation, though its "n/a" uncertainty makes this less reliable. The mean-IMM line's high variability (19.16) indicates inconsistent performance across methods, while mode-IMM's stability (1.87) suggests common failure modes. The sharp declines observed in most methods after T1 highlight challenges in maintaining performance across sequential tasks, with EWC and MAS showing better long-term retention than LwF and finetuning.
DECODING INTELLIGENCE...