## Line Chart: Continual Learning Model Performance Evaluation
### Overview
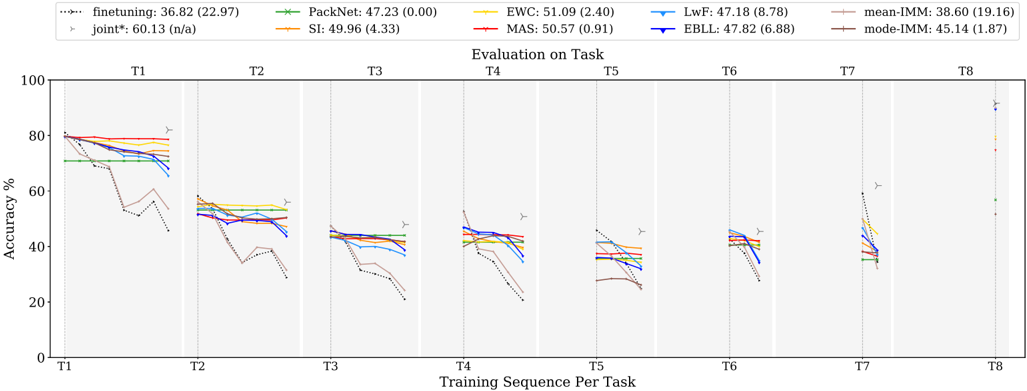
This image displays a performance evaluation chart for various machine learning models in a "continual learning" context. The chart tracks the accuracy of models on specific tasks (T1 through T8) as the models continue to train on subsequent tasks. The downward slope of the lines within each task block illustrates "catastrophic forgetting," where a model's performance on previously learned tasks degrades as it learns new ones.
### Components/Axes
* **Y-Axis:** "Accuracy %", ranging from 0 to 100.
* **X-Axis:** "Training Sequence Per Task", divided into 8 distinct vertical regions labeled T1 through T8.
* **Legend:** Positioned at the top of the chart. It lists the methods, their average accuracy, and standard deviation (in parentheses).
* **finetuning**: Dotted black line. (36.82 ± 22.97)
* **joint\***: Grey triangle marker (appears only at T8). (60.13 ± n/a)
* **PackNet**: Green line with 'x' markers. (47.23 ± 0.00)
* **SI**: Orange line with '+' markers. (49.96 ± 4.33)
* **EWC**: Yellow line. (51.09 ± 2.40)
* **MAS**: Red line. (50.57 ± 0.91)
* **LwF**: Light blue line. (47.18 ± 8.78)
* **EBLL**: Dark blue line with triangle markers. (47.82 ± 6.88)
* **mean-IMM**: Light brown/tan line. (38.60 ± 19.16)
* **mode-IMM**: Dark brown line. (45.14 ± 1.87)
### Detailed Analysis
The chart is segmented into 8 vertical panels (T1–T8). Each panel represents the accuracy of the models on that specific task as the training progresses through the sequence.
* **T1 Panel:** All models begin with high accuracy (~80%). The `finetuning` (dotted black) line shows the steepest decline, dropping to ~45%. `PackNet` (green) remains nearly flat at ~70%.
* **T2 Panel:** Models start at ~50–55%. `finetuning` drops sharply to ~30%. `PackNet` remains stable at ~55%.
* **T3 Panel:** Models start at ~45%. `finetuning` drops to ~20%. Other models cluster between 30% and 45%.
* **T4 Panel:** Models start at ~45–50%. `finetuning` drops to ~20%.
* **T5 Panel:** Models start at ~35–45%.
* **T6 Panel:** Models start at ~40–45%.
* **T7 Panel:** Models start at ~45–60%.
* **T8 Panel:** This column acts as a summary of final performance. The `joint*` method (grey triangle) is the clear outlier at the top (~90%), representing the theoretical upper bound (training on all data simultaneously). `finetuning` is at the bottom.
### Key Observations
* **Catastrophic Forgetting:** The `finetuning` method (dotted black line) consistently exhibits the most severe performance degradation across all tasks, confirming it is the most susceptible to forgetting previous information.
* **Stability vs. Plasticity:** `PackNet` (green line) demonstrates the highest stability (the line is almost horizontal), indicating it effectively preserves knowledge of previous tasks, though its starting accuracy is lower than other methods.
* **Performance Gap:** There is a significant performance gap between the `joint*` method (the oracle) and the continual learning methods, particularly in later tasks.
* **Method Clustering:** Most regularization-based methods (EWC, MAS, SI, EBLL) cluster together in the middle of the performance range, showing moderate forgetting.
### Interpretation
This chart demonstrates the fundamental challenge of Continual Learning: balancing the ability to learn new tasks (plasticity) with the ability to retain knowledge of old tasks (stability).
* **The "Finetuning" Baseline:** The steep downward slope of the `finetuning` line is the benchmark for "catastrophic forgetting." It shows that without specific mechanisms to protect old knowledge, neural networks quickly overwrite previous weights with new information.
* **The "Joint" Oracle:** The `joint*` marker at T8 represents the "upper bound" of performance. It is the accuracy achievable if the model had access to all data from all tasks simultaneously. The distance between the other methods and this `joint*` point quantifies the "forgetting" penalty of each approach.
* **Architectural vs. Regularization:** The flat line of `PackNet` suggests an architectural approach (likely parameter isolation or masking) that is highly effective at preventing interference between tasks, whereas the other methods (EWC, MAS, etc.) are likely regularization-based, which struggle more to maintain performance over long sequences.