\n
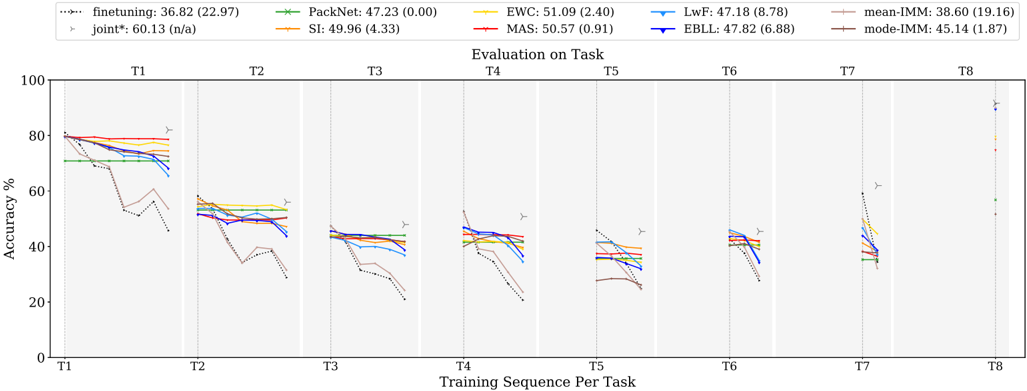
## Line Chart: Accuracy vs. Training Sequence Per Task
### Overview
This line chart depicts the accuracy performance of several machine learning algorithms across eight tasks (T1-T8) as the training sequence progresses. The y-axis represents accuracy in percentage, while the x-axis represents the training sequence per task. Each line represents a different algorithm, and error bars are shown at each task to indicate variance.
### Components/Axes
* **X-axis:** "Training Sequence Per Task" with markers T1, T2, T3, T4, T5, T6, T7, and T8.
* **Y-axis:** "Accuracy %" ranging from 0 to 80, with increments of 10.
* **Legend:** Located at the top-right of the chart, listing the algorithms and their corresponding colors:
* finetuning: 36.82 (22.97) - Dotted line, purple color.
* joint*: 60.13 (n/a) - Dashed line, dark green color.
* PackNet: 47.23 (0.00) - Solid line, light green color.
* SI: 49.96 (4.33) - Solid line, orange color.
* EWC: 51.09 (2.40) - Solid line, red color.
* LwF: 47.18 (8.78) - Solid line, blue color.
* MAS: 50.57 (0.91) - Solid line, dark red color.
* EBLL: 47.82 (6.88) - Solid line, yellow color.
* mean-IMM: 38.60 (19.16) - Solid line, light blue color.
* mode-IMM: 45.14 (1.87) - Solid line, brown color.
* **Error Bars:** Represented by small vertical lines with 'T' shaped ends at each data point, indicating the standard deviation or confidence interval.
### Detailed Analysis
The chart shows the accuracy of each algorithm as it is trained on successive tasks. The following details are observed:
* **Finetuning (purple, dotted):** Starts at approximately 82% accuracy at T1 and declines steadily to around 20% by T8.
* **Joint* (dark green, dashed):** Starts at approximately 80% accuracy at T1 and declines to around 40% by T8.
* **PackNet (light green, solid):** Starts at approximately 80% accuracy at T1 and declines to around 30% by T8.
* **SI (orange, solid):** Starts at approximately 80% accuracy at T1 and declines to around 35% by T8.
* **EWC (red, solid):** Starts at approximately 80% accuracy at T1 and declines to around 40% by T8.
* **LwF (blue, solid):** Starts at approximately 80% accuracy at T1 and declines to around 30% by T8.
* **MAS (dark red, solid):** Starts at approximately 80% accuracy at T1 and declines to around 40% by T8.
* **EBLL (yellow, solid):** Starts at approximately 80% accuracy at T1 and declines to around 30% by T8.
* **mean-IMM (light blue, solid):** Starts at approximately 80% accuracy at T1 and declines to around 25% by T8.
* **mode-IMM (brown, solid):** Starts at approximately 80% accuracy at T1 and declines to around 35% by T8.
All algorithms show a general downward trend in accuracy as the training sequence progresses. The rate of decline varies between algorithms. The error bars indicate that the accuracy values have some variance, but the overall trends are clear.
### Key Observations
* All algorithms experience catastrophic forgetting, as evidenced by the decreasing accuracy across tasks.
* The "joint*" algorithm appears to maintain a slightly higher accuracy compared to most other algorithms, especially in the later tasks (T5-T8).
* The "finetuning" algorithm exhibits the most significant decline in accuracy.
* The error bars are relatively small for most algorithms, suggesting consistent performance.
### Interpretation
The chart demonstrates the challenge of continual learning, where models struggle to retain knowledge from previous tasks when learning new ones. This phenomenon is known as catastrophic forgetting. The algorithms tested here represent different approaches to mitigating catastrophic forgetting, but all exhibit some degree of performance degradation as the number of tasks increases.
The "joint*" algorithm's relatively stable performance suggests that it may be more effective at preserving knowledge across tasks. The significant decline in "finetuning" indicates that it is highly susceptible to catastrophic forgetting. The error bars provide a measure of the reliability of the accuracy estimates, and their relatively small size suggests that the observed trends are statistically significant.
The data suggests that continual learning is a complex problem that requires careful consideration of the trade-off between learning new tasks and preserving knowledge from old ones. Further research is needed to develop algorithms that can effectively address catastrophic forgetting and enable machines to learn continuously over time.