## Line Graph: Evaluation on Task Accuracy Across Training Sequences
### Overview
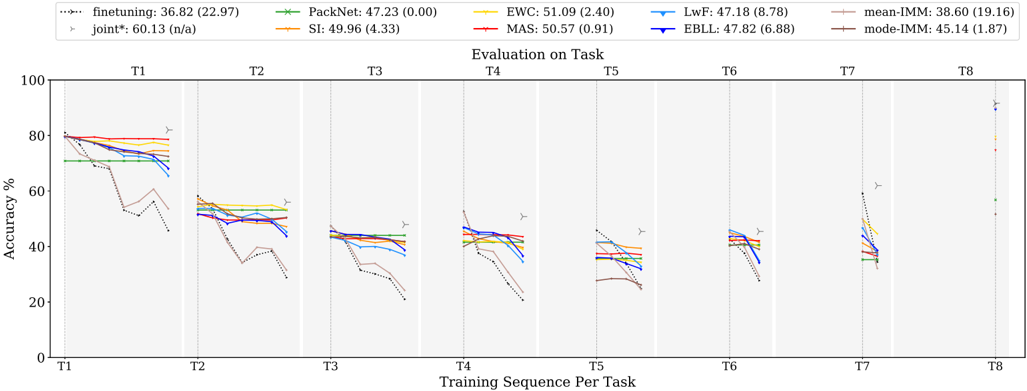
The image is a multi-line graph comparing the accuracy performance of various machine learning methods across eight training tasks (T1-T8). The y-axis represents accuracy percentage (0-100%), while the x-axis shows sequential training tasks. The graph includes eight distinct data series representing different model configurations, with a legend at the top providing method names, colors, and performance metrics.
### Components/Axes
- **X-axis**: "Training Sequence Per Task" labeled with tasks T1 through T8
- **Y-axis**: "Accuracy %" scaled from 0 to 100
- **Legend**: Located at the top with 8 entries:
1. finetuning: 36.82 (22.97) - black dotted line
2. PackNet: 47.23 (0.00) - green star line
3. EWC: 51.09 (2.40) - yellow line
4. MAS: 50.57 (0.91) - red line
5. LwF: 47.18 (8.78) - blue line
6. EBLL: 47.82 (6.88) - dark blue line
7. mean-IMM: 38.60 (19.16) - light brown dashed line
8. mode-IMM: 45.14 (1.87) - dark brown dashed line
- **Additional Elements**:
- Vertical gray lines separating task boundaries
- Yellow triangle markers at task boundaries
- Vertical dashed lines at task boundaries
- "joint*": 60.13 (n/a) - gray triangle marker
### Detailed Analysis
1. **Finetuning** (black dotted line):
- Starts at ~80% on T1
- Sharp decline to ~40% by T3
- Fluctuates between 30-50% through T8
- Final value: 36.82% (22.97 uncertainty)
2. **PackNet** (green star line):
- Maintains ~47% accuracy across all tasks
- Minimal variation (0.00 uncertainty)
- Consistent performance with slight dip at T7
3. **EWC** (yellow line):
- Peaks at ~51% on T1
- Gradual decline to ~40% by T8
- Moderate stability with 2.40 uncertainty
4. **MAS** (red line):
- Starts at ~50% on T1
- Slight decline to ~45% by T8
- Very stable with 0.91 uncertainty
5. **LwF** (blue line):
- Begins at ~47% on T1
- Sharp drop to ~30% by T3
- Recovers to ~40% by T8
- High variability (8.78 uncertainty)
6. **EBLL** (dark blue line):
- Starts at ~48% on T1
- Gradual decline to ~40% by T8
- Moderate stability (6.88 uncertainty)
7. **mean-IMM** (light brown dashed line):
- Starts at ~38% on T1
- Sharp decline to ~20% by T3
- Recovers to ~30% by T8
- High variability (19.16 uncertainty)
8. **mode-IMM** (dark brown dashed line):
- Starts at ~45% on T1
- Gradual decline to ~35% by T8
- Most stable with 1.87 uncertainty
### Key Observations
1. **Performance Variance**:
- EWC shows highest initial performance (51.09%) but declines over time
- PackNet maintains most consistent performance (47.23% ±0.00)
- Finetuning has highest initial accuracy (80%) but largest drop-off
2. **Task-Specific Patterns**:
- T1 shows highest overall performance across methods
- T8 has most significant performance drops for most methods
- Joint* method (gray triangle) shows highest performance at T8 (60.13%)
3. **Uncertainty Patterns**:
- Finetuning has highest uncertainty (22.97)
- PackNet has perfect certainty (0.00)
- MAS shows lowest uncertainty (0.91)
### Interpretation
The data demonstrates significant variability in model performance across training tasks. PackNet's perfect certainty and consistent performance suggest superior stability, while finetuning's high initial accuracy but large uncertainty indicates potential overfitting. The joint* method's superior T8 performance (60.13%) suggests effective long-term adaptation, though its "n/a" uncertainty makes this less reliable. The mean-IMM line's high variability (19.16) indicates inconsistent performance across methods, while mode-IMM's stability (1.87) suggests common failure modes. The sharp declines observed in most methods after T1 highlight challenges in maintaining performance across sequential tasks, with EWC and MAS showing better long-term retention than LwF and finetuning.