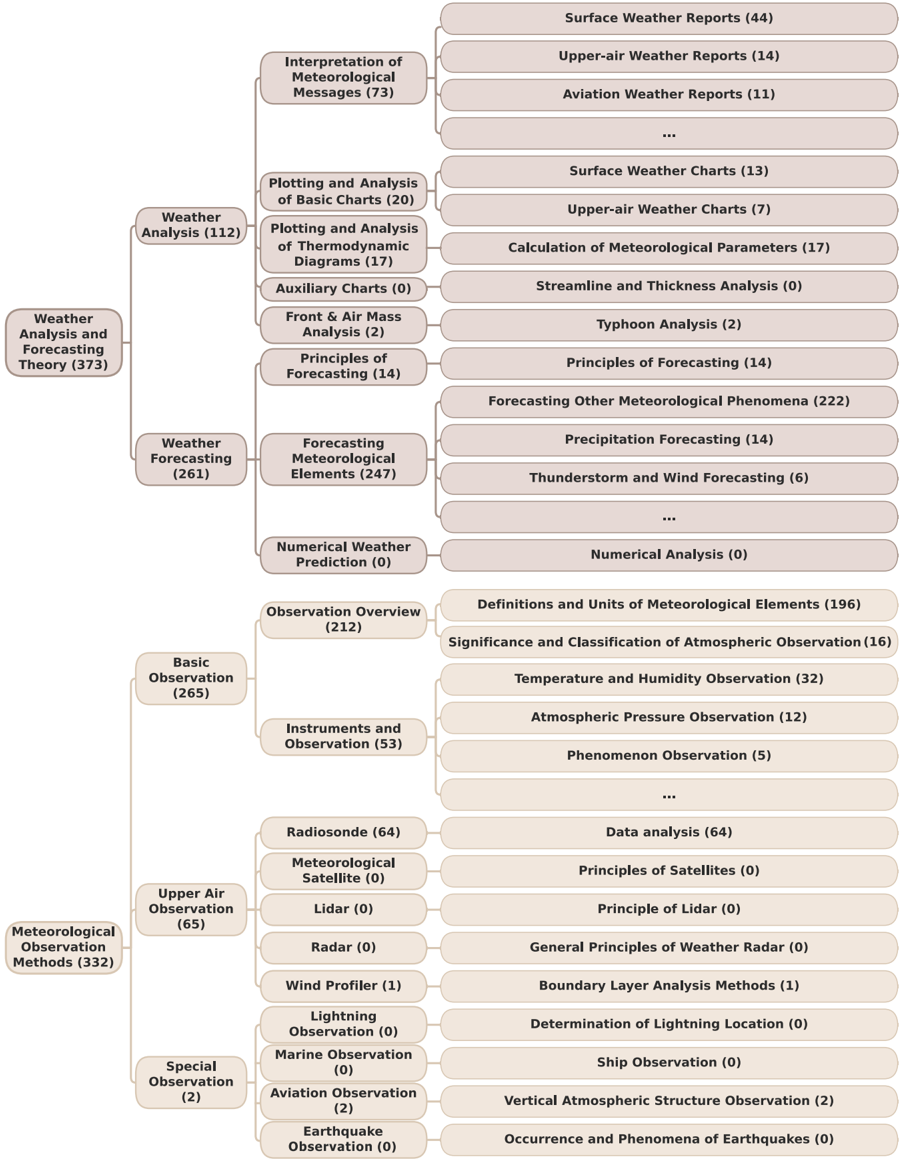
## Hierarchical Diagram: Meteorological Analysis and Forecasting Curriculum
### Overview
The diagram presents a structured breakdown of meteorological analysis and forecasting topics, organized hierarchically with numerical values in parentheses likely representing topic counts, scores, or curriculum weights. The structure emphasizes observational methods, data interpretation, and forecasting techniques.
### Components/Axes
- **Main Categories** (e.g., "Interpretation of Meteorological Messages (73)", "Weather Forecasting (261)")
- **Subcategories** (e.g., "Surface Weather Reports (44)", "Thermodynamic Diagrams (17)")
- **Numerical Values** in parentheses (interpreted as topic counts or emphasis metrics)
### Detailed Analysis
#### Interpretation of Meteorological Messages (73)
- Surface Weather Reports (44)
- Upper-air Weather Reports (14)
- Aviation Weather Reports (11)
- Surface Weather Charts (13)
- Upper-air Weather Charts (7)
- Calculation of Meteorological Parameters (17)
- Streamline and Thickness Analysis (0)
- Typhoon Analysis (2)
- Front & Air Mass Analysis (2)
#### Plotting and Analysis of Basic Charts (20)
- Surface Weather Charts (13)
- Upper-air Weather Charts (7)
#### Plotting and Analysis of Thermodynamic Diagrams (17)
- Calculation of Meteorological Parameters (17)
#### Auxiliary Charts (0)
- Streamline and Thickness Analysis (0)
#### Front & Air Mass Analysis (2)
- Front & Air Mass Analysis (2)
#### Principles of Forecasting (14)
- Forecasting Other Meteorological Phenomena (222)
- Principles of Forecasting (14)
#### Weather Forecasting (261)
- Forecasting Meteorological Elements (247)
- Thunderstorm and Wind Forecasting (6)
- Precipitation Forecasting (14)
- Forecasting Other Meteorological Phenomena (222)
#### Forecasting Meteorological Elements (247)
- Thunderstorm and Wind Forecasting (6)
- Precipitation Forecasting (14)
#### Numerical Weather Prediction (0)
- Numerical Analysis (0)
#### Observation Overview (212)
- Definitions and Units of Meteorological Elements (196)
- Significance and Classification of Atmospheric Observation (16)
#### Instruments and Observation (53)
- Temperature and Humidity Observation (32)
- Atmospheric Pressure Observation (12)
- Phenomenon Observation (5)
#### Upper Air Observation (65)
- Radiosonde (64)
- Data analysis (64)
- Satellite (0)
- Lidar (0)
- Radar (0)
- Boundary Layer Analysis Methods (1)
#### Special Observation (2)
- Aviation Observation (2)
- Vertical Atmospheric Structure Observation (2)
#### Meteorological Observation Methods (332)
- Marine Observation (0)
- Ship Observation (0)
- Lightning Observation (0)
- Determination of Lightning Location (0)
- Earthquake Observation (0)
- Occurrence and Phenomena of Earthquakes (0)
### Key Observations
1. **High Emphasis on Forecasting**: "Forecasting Other Meteorological Phenomena (222)" dominates, suggesting prioritization of advanced forecasting techniques.
2. **Observational Focus**: "Radiosonde (64)" and "Data analysis (64)" indicate significant attention to upper-air data collection.
3. **Low Coverage Areas**: "Auxiliary Charts (0)" and "Numerical Weather Prediction (0)" may reflect gaps or emerging topics.
4. **Hierarchical Depth**: Subcategories like "Boundary Layer Analysis Methods (1)" and "Vertical Atmospheric Structure Observation (2)" show niche but critical areas.
### Interpretation
The diagram likely represents a curriculum or training framework for meteorologists. High values in forecasting and observational methods (e.g., radiosondes) suggest these are core competencies. Zero values in auxiliary charts and numerical prediction may indicate either incomplete coverage or specialized focus. The structure implies a progression from basic observation (e.g., temperature, pressure) to complex forecasting, with thermodynamic diagrams and front analysis bridging observational data to predictive models. The absence of numerical weather prediction content could signal a theoretical emphasis over computational methods.