## Heatmap: Classification Accuracies
### Overview
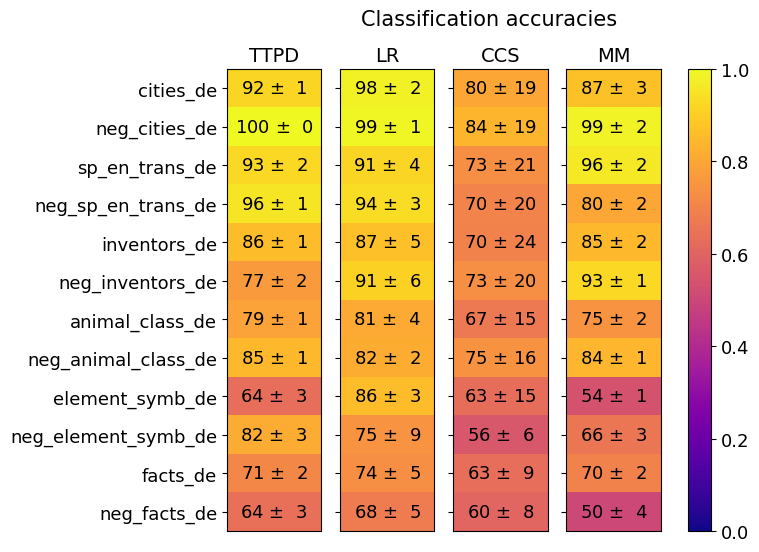
The image is a heatmap displaying classification accuracies for different models (TTPD, LR, CCS, MM) across various categories (e.g., cities_de, neg_cities_de). The heatmap uses a color gradient from dark blue (0.0) to bright yellow (1.0) to represent the accuracy values. Each cell contains the accuracy value ± its standard deviation.
### Components/Axes
* **Title:** Classification accuracies
* **Columns (Models):** TTPD, LR, CCS, MM
* **Rows (Categories):** cities\_de, neg\_cities\_de, sp\_en\_trans\_de, neg\_sp\_en\_trans\_de, inventors\_de, neg\_inventors\_de, animal\_class\_de, neg\_animal\_class\_de, element\_symb\_de, neg\_element\_symb\_de, facts\_de, neg\_facts\_de
* **Colorbar:** Ranges from 0.0 (dark blue) to 1.0 (bright yellow), with intermediate values indicated.
### Detailed Analysis or ### Content Details
Here's a breakdown of the data, organized by category and model:
* **cities\_de:**
* TTPD: 92 ± 1
* LR: 98 ± 2
* CCS: 80 ± 19
* MM: 87 ± 3
* **neg\_cities\_de:**
* TTPD: 100 ± 0
* LR: 99 ± 1
* CCS: 84 ± 19
* MM: 99 ± 2
* **sp\_en\_trans\_de:**
* TTPD: 93 ± 2
* LR: 91 ± 4
* CCS: 73 ± 21
* MM: 96 ± 2
* **neg\_sp\_en\_trans\_de:**
* TTPD: 96 ± 1
* LR: 94 ± 3
* CCS: 70 ± 20
* MM: 80 ± 2
* **inventors\_de:**
* TTPD: 86 ± 1
* LR: 87 ± 5
* CCS: 70 ± 24
* MM: 85 ± 2
* **neg\_inventors\_de:**
* TTPD: 77 ± 2
* LR: 91 ± 6
* CCS: 73 ± 20
* MM: 93 ± 1
* **animal\_class\_de:**
* TTPD: 79 ± 1
* LR: 81 ± 4
* CCS: 67 ± 15
* MM: 75 ± 2
* **neg\_animal\_class\_de:**
* TTPD: 85 ± 1
* LR: 82 ± 2
* CCS: 75 ± 16
* MM: 84 ± 1
* **element\_symb\_de:**
* TTPD: 64 ± 3
* LR: 86 ± 3
* CCS: 63 ± 15
* MM: 54 ± 1
* **neg\_element\_symb\_de:**
* TTPD: 82 ± 3
* LR: 75 ± 9
* CCS: 56 ± 6
* MM: 66 ± 3
* **facts\_de:**
* TTPD: 71 ± 2
* LR: 74 ± 5
* CCS: 63 ± 9
* MM: 70 ± 2
* **neg\_facts\_de:**
* TTPD: 64 ± 3
* LR: 68 ± 5
* CCS: 60 ± 8
* MM: 50 ± 4
### Key Observations
* **LR** generally has high accuracy across most categories.
* **CCS** tends to have the lowest accuracy and the highest standard deviation.
* **TTPD** and **MM** show comparable performance, with some categories favoring one over the other.
* The "neg\_cities\_de" category shows near-perfect accuracy for TTPD, LR, and MM.
* The "element\_symb\_de" category has relatively low accuracy for TTPD and MM compared to LR.
### Interpretation
The heatmap provides a visual comparison of the classification accuracies of four different models across twelve categories. The color gradient allows for a quick assessment of relative performance. The data suggests that the LR model performs consistently well across most categories, while the CCS model struggles, exhibiting both lower accuracy and higher variability. The TTPD and MM models offer competitive performance, with their relative strengths varying depending on the specific category. The high standard deviations for CCS indicate that its performance is less stable and more sensitive to the specific dataset or conditions. The models seem to perform well on negative cities, but struggle with negative facts and element symbols.