## Heatmap: Classification Accuracies
### Overview
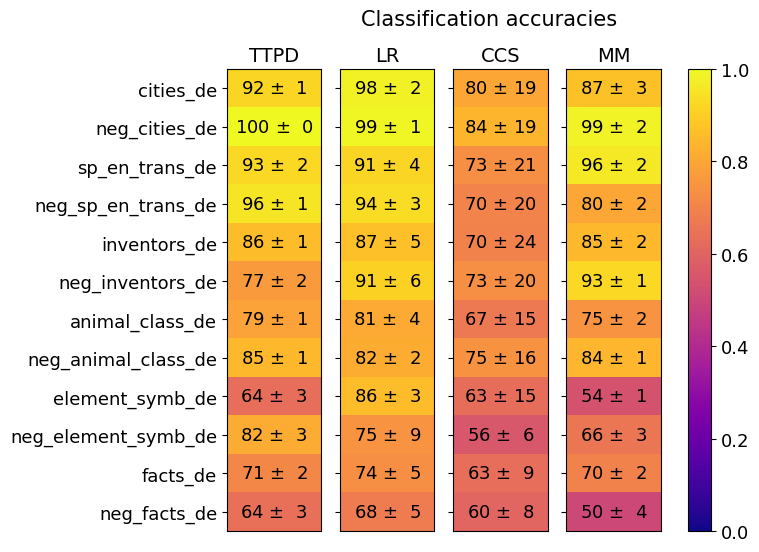
This image presents a heatmap displaying classification accuracies for various datasets and models. The heatmap visualizes the performance of four different models (TTPD, LR, CCS, MM) across twelve different datasets, all in the German language ("_de"). Each cell represents the accuracy, indicated by color, with associated standard deviation.
### Components/Axes
* **Rows (Datasets):**
* cities_de
* neg_cities_de
* sp_en_trans_de
* neg_sp_en_trans_de
* inventors_de
* neg_inventors_de
* animal_class_de
* neg_animal_class_de
* element_symb_de
* neg_element_symb_de
* facts_de
* neg_facts_de
* **Columns (Models):**
* TTPD
* LR
* CCS
* MM
* **Color Scale (Right Side):** Represents accuracy, ranging from 0.0 (dark purple) to 1.0 (dark yellow). The scale is marked at 0.0, 0.2, 0.4, 0.6, 0.8, and 1.0.
* **Title:** "Classification accuracies" positioned at the top-center.
### Detailed Analysis
The heatmap displays accuracy values with standard deviations (e.g., "92 ± 1"). I will analyze each cell, referencing the color scale to verify the accuracy level.
* **cities_de:**
* TTPD: 92 ± 1 (Yellow-Orange)
* LR: 98 ± 2 (Dark Yellow)
* CCS: 80 ± 19 (Orange)
* MM: 87 ± 3 (Yellow-Orange)
* **neg_cities_de:**
* TTPD: 100 ± 0 (Dark Yellow)
* LR: 99 ± 1 (Dark Yellow)
* CCS: 84 ± 19 (Orange)
* MM: 99 ± 2 (Dark Yellow)
* **sp_en_trans_de:**
* TTPD: 93 ± 2 (Yellow-Orange)
* LR: 91 ± 4 (Yellow)
* CCS: 73 ± 21 (Orange)
* MM: 96 ± 2 (Dark Yellow)
* **neg_sp_en_trans_de:**
* TTPD: 96 ± 1 (Dark Yellow)
* LR: 94 ± 3 (Yellow)
* CCS: 70 ± 20 (Orange)
* MM: 80 ± 2 (Yellow-Orange)
* **inventors_de:**
* TTPD: 86 ± 1 (Yellow)
* LR: 87 ± 5 (Yellow)
* CCS: 70 ± 24 (Orange)
* MM: 85 ± 2 (Yellow-Orange)
* **neg_inventors_de:**
* TTPD: 77 ± 2 (Orange)
* LR: 91 ± 6 (Yellow)
* CCS: 73 ± 20 (Orange)
* MM: 93 ± 1 (Dark Yellow)
* **animal_class_de:**
* TTPD: 79 ± 1 (Orange)
* LR: 81 ± 4 (Yellow)
* CCS: 67 ± 15 (Orange)
* MM: 75 ± 2 (Yellow)
* **neg_animal_class_de:**
* TTPD: 85 ± 1 (Yellow)
* LR: 82 ± 2 (Yellow)
* CCS: 75 ± 16 (Orange)
* MM: 84 ± 1 (Yellow-Orange)
* **element_symb_de:**
* TTPD: 64 ± 3 (Orange)
* LR: 86 ± 3 (Yellow)
* CCS: 63 ± 15 (Orange)
* MM: 54 ± 1 (Orange)
* **neg_element_symb_de:**
* TTPD: 82 ± 3 (Yellow)
* LR: 75 ± 9 (Orange)
* CCS: 56 ± 6 (Orange)
* MM: 66 ± 3 (Orange)
* **facts_de:**
* TTPD: 71 ± 2 (Orange)
* LR: 74 ± 5 (Orange)
* CCS: 63 ± 9 (Orange)
* MM: 70 ± 2 (Orange)
* **neg_facts_de:**
* TTPD: 64 ± 3 (Orange)
* LR: 68 ± 5 (Orange)
* CCS: 60 ± 8 (Orange)
* MM: 50 ± 4 (Orange)
### Key Observations
* The "neg_" datasets generally exhibit higher accuracies than their non-"neg_" counterparts, particularly for TTPD and LR. This suggests the models perform better on negative examples.
* LR consistently achieves high accuracy across most datasets, often reaching the maximum value of 1.0.
* CCS consistently shows the lowest accuracies, generally falling in the orange range.
* The standard deviations are relatively small for most data points, indicating consistent performance.
* The "element_symb_de" and "facts_de" datasets consistently show lower accuracies across all models.
### Interpretation
This heatmap demonstrates the performance of different machine learning models on various German-language datasets. The "neg_" prefix likely indicates datasets constructed with negative examples (e.g., incorrect statements or non-examples of a category). The higher accuracy on these negative datasets suggests the models are effective at identifying incorrect or irrelevant information. The consistent high performance of the LR model indicates its suitability for these classification tasks. The lower performance of CCS suggests it may be less effective for these specific datasets or requires further tuning. The lower accuracies observed for "element_symb_de" and "facts_de" could indicate inherent difficulty in classifying these types of data, or a need for more specialized models or features. The color scale provides a clear visual representation of the relative performance of each model on each dataset, allowing for quick identification of strengths and weaknesses. The heatmap is a valuable tool for comparing model performance and identifying areas for improvement.