## Line Chart: Performance Models vs. Benchmarks
### Overview
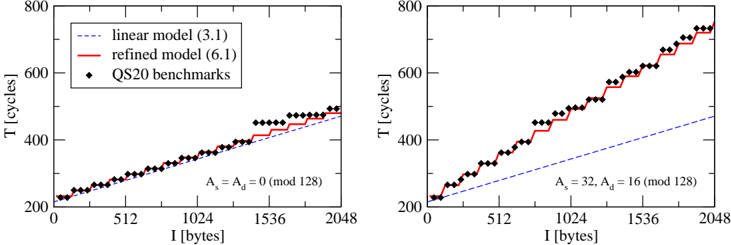
The image presents two line charts comparing performance models (linear and refined) against QS20 benchmarks. The charts depict the relationship between 'I' (bytes) on the x-axis and 'T' (cycles) on the y-axis. The left chart shows data for As = Ad = 0 (mod 128), while the right chart shows data for As = 32, Ad = 16 (mod 128).
### Components/Axes
* **X-axis (Horizontal):** 'I [bytes]' - Represents the input size in bytes, ranging from 0 to 2048 in both charts. Axis markers are present at 0, 512, 1024, 1536, and 2048.
* **Y-axis (Vertical):** 'T [cycles]' - Represents the time in cycles, ranging from 200 to 800. Axis markers are present at 200, 400, 600, and 800.
* **Legend (Top-Left of each chart):**
* **Blue Dashed Line:** 'linear model (3.1)'
* **Red Solid Line:** 'refined model (6.1)'
* **Black Diamonds:** 'QS20 benchmarks'
* **Text Labels (Bottom-Center of each chart):**
* Left Chart: "As = Ad = 0 (mod 128)"
* Right Chart: "As = 32, Ad = 16 (mod 128)"
### Detailed Analysis
**Left Chart (As = Ad = 0 (mod 128)):**
* **Linear Model (Blue Dashed Line):** The linear model shows a steady, positive linear relationship between input size and cycles. It starts at approximately 220 cycles at 0 bytes and increases to approximately 480 cycles at 2048 bytes.
* **Refined Model (Red Solid Line):** The refined model initially closely follows the linear model up to approximately 1024 bytes. After that, it increases in a step-wise fashion, with plateaus and then jumps. It ends at approximately 500 cycles at 2048 bytes.
* **QS20 Benchmarks (Black Diamonds):** The QS20 benchmarks closely follow both models up to approximately 1024 bytes. After that, the benchmarks tend to follow the refined model's step-wise pattern, but with some deviation. The data points are scattered around the refined model line.
**Right Chart (As = 32, Ad = 16 (mod 128)):**
* **Linear Model (Blue Dashed Line):** Similar to the left chart, the linear model shows a steady, positive linear relationship. It starts at approximately 220 cycles at 0 bytes and increases to approximately 400 cycles at 2048 bytes.
* **Refined Model (Red Solid Line):** The refined model shows a step-wise increase, with plateaus and jumps. It starts at approximately 220 cycles at 0 bytes and increases to approximately 740 cycles at 2048 bytes.
* **QS20 Benchmarks (Black Diamonds):** The QS20 benchmarks closely follow the refined model's step-wise pattern. The data points are scattered around the refined model line.
### Key Observations
* The refined model provides a better fit for the QS20 benchmarks than the linear model, especially at larger input sizes.
* The step-wise pattern in the refined model suggests some kind of threshold or discrete behavior in the system being benchmarked.
* The right chart (As = 32, Ad = 16) shows a more pronounced step-wise pattern and a higher overall cycle count compared to the left chart (As = Ad = 0).
* The linear model consistently underestimates the cycle count compared to the refined model and the QS20 benchmarks, especially at larger input sizes.
### Interpretation
The charts illustrate the performance characteristics of a system under different conditions (As and Ad values). The refined model captures the system's behavior more accurately than the linear model, indicating that the system's performance is not simply a linear function of input size. The step-wise pattern suggests that the system's performance is affected by factors such as cache misses, page faults, or other discrete events that occur as the input size increases. The difference in performance between the two charts (different As and Ad values) suggests that these parameters have a significant impact on the system's performance. The QS20 benchmarks validate the refined model, showing that it is a reasonable approximation of the system's actual performance.