TECHNICAL ASSET FINGERPRINT
a4c984472ec7091218b05789
Click to view fullscreen
Press ESC or click to close
FOUND IN PAPERS
EXPERT: gemini-2.0-flash VERSION 1
RUNTIME: nugit/gemini/gemini-2.0-flash
INTEL_VERIFIED
## Heatmap: Coverage of Different Generation Methods
### Overview
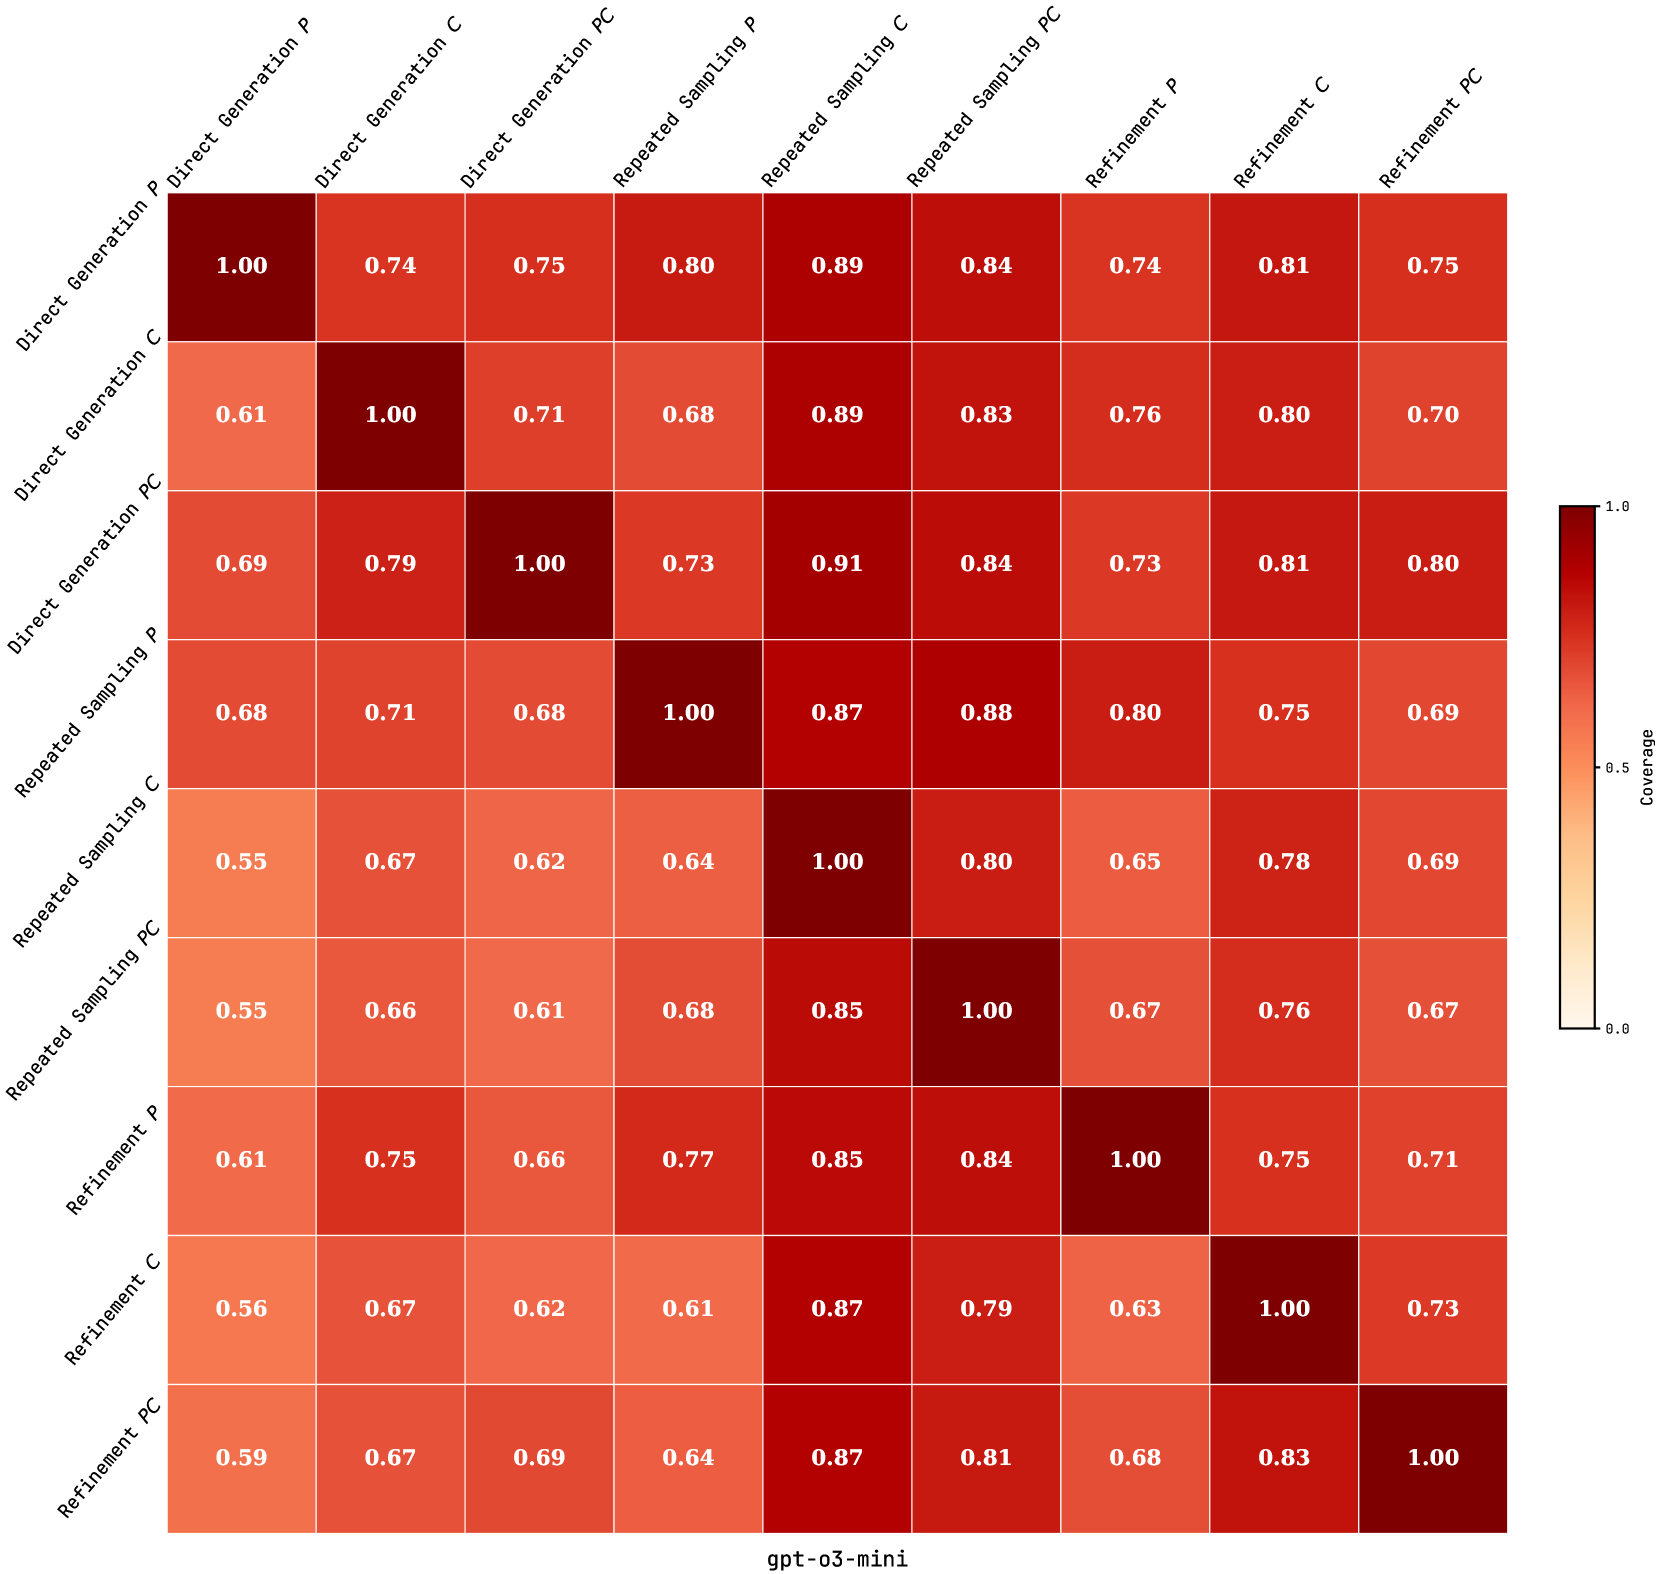
The image is a heatmap displaying the coverage between different text generation methods using the "gpt-03-mini" model. The heatmap shows the pairwise coverage scores, with darker red shades indicating higher coverage and lighter shades indicating lower coverage. The methods compared are Direct Generation, Repeated Sampling, and Refinement, each using P, C, and PC configurations.
### Components/Axes
* **X-axis (Columns):** Text generation methods: "Direct Generation P", "Direct Generation C", "Direct Generation PC", "Repeated Sampling P", "Repeated Sampling C", "Repeated Sampling PC", "Refinement P", "Refinement C", "Refinement PC".
* **Y-axis (Rows):** Text generation methods: "Direct Generation P", "Direct Generation C", "Direct Generation PC", "Repeated Sampling P", "Repeated Sampling C", "Repeated Sampling PC", "Refinement P", "Refinement C", "Refinement PC".
* **Color Scale (Legend):** Located on the right side of the heatmap. The scale ranges from 0.0 (lightest shade) to 1.0 (darkest shade), representing the "Coverage" score.
* **Model Name:** "gpt-03-mini" is printed at the bottom center of the heatmap.
### Detailed Analysis
The heatmap presents a matrix of coverage scores between different text generation methods. Each cell contains a numerical value representing the coverage between the method on the Y-axis (row) and the method on the X-axis (column). The diagonal elements, where the row and column methods are the same, have a coverage of 1.00, indicated by the darkest red color.
Here's a breakdown of the coverage scores:
* **Direct Generation P:**
* Coverage with Direct Generation P: 1.00
* Coverage with Direct Generation C: 0.74
* Coverage with Direct Generation PC: 0.75
* Coverage with Repeated Sampling P: 0.80
* Coverage with Repeated Sampling C: 0.89
* Coverage with Repeated Sampling PC: 0.84
* Coverage with Refinement P: 0.74
* Coverage with Refinement C: 0.81
* Coverage with Refinement PC: 0.75
* **Direct Generation C:**
* Coverage with Direct Generation P: 0.61
* Coverage with Direct Generation C: 1.00
* Coverage with Direct Generation PC: 0.71
* Coverage with Repeated Sampling P: 0.68
* Coverage with Repeated Sampling C: 0.89
* Coverage with Repeated Sampling PC: 0.83
* Coverage with Refinement P: 0.76
* Coverage with Refinement C: 0.80
* Coverage with Refinement PC: 0.70
* **Direct Generation PC:**
* Coverage with Direct Generation P: 0.69
* Coverage with Direct Generation C: 0.79
* Coverage with Direct Generation PC: 1.00
* Coverage with Repeated Sampling P: 0.73
* Coverage with Repeated Sampling C: 0.91
* Coverage with Repeated Sampling PC: 0.84
* Coverage with Refinement P: 0.73
* Coverage with Refinement C: 0.81
* Coverage with Refinement PC: 0.80
* **Repeated Sampling P:**
* Coverage with Direct Generation P: 0.68
* Coverage with Direct Generation C: 0.71
* Coverage with Direct Generation PC: 0.68
* Coverage with Repeated Sampling P: 1.00
* Coverage with Repeated Sampling C: 0.87
* Coverage with Repeated Sampling PC: 0.88
* Coverage with Refinement P: 0.80
* Coverage with Refinement C: 0.75
* Coverage with Refinement PC: 0.69
* **Repeated Sampling C:**
* Coverage with Direct Generation P: 0.55
* Coverage with Direct Generation C: 0.67
* Coverage with Direct Generation PC: 0.62
* Coverage with Repeated Sampling P: 0.64
* Coverage with Repeated Sampling C: 1.00
* Coverage with Repeated Sampling PC: 0.80
* Coverage with Refinement P: 0.65
* Coverage with Refinement C: 0.78
* Coverage with Refinement PC: 0.69
* **Repeated Sampling PC:**
* Coverage with Direct Generation P: 0.55
* Coverage with Direct Generation C: 0.66
* Coverage with Direct Generation PC: 0.61
* Coverage with Repeated Sampling P: 0.68
* Coverage with Repeated Sampling C: 0.85
* Coverage with Repeated Sampling PC: 1.00
* Coverage with Refinement P: 0.67
* Coverage with Refinement C: 0.76
* Coverage with Refinement PC: 0.67
* **Refinement P:**
* Coverage with Direct Generation P: 0.61
* Coverage with Direct Generation C: 0.75
* Coverage with Direct Generation PC: 0.66
* Coverage with Repeated Sampling P: 0.77
* Coverage with Repeated Sampling C: 0.85
* Coverage with Repeated Sampling PC: 0.84
* Coverage with Refinement P: 1.00
* Coverage with Refinement C: 0.75
* Coverage with Refinement PC: 0.71
* **Refinement C:**
* Coverage with Direct Generation P: 0.56
* Coverage with Direct Generation C: 0.67
* Coverage with Direct Generation PC: 0.62
* Coverage with Repeated Sampling P: 0.61
* Coverage with Repeated Sampling C: 0.87
* Coverage with Repeated Sampling PC: 0.79
* Coverage with Refinement P: 0.63
* Coverage with Refinement C: 1.00
* Coverage with Refinement PC: 0.73
* **Refinement PC:**
* Coverage with Direct Generation P: 0.59
* Coverage with Direct Generation C: 0.67
* Coverage with Direct Generation PC: 0.69
* Coverage with Repeated Sampling P: 0.64
* Coverage with Repeated Sampling C: 0.87
* Coverage with Repeated Sampling PC: 0.81
* Coverage with Refinement P: 0.68
* Coverage with Refinement C: 0.83
* Coverage with Refinement PC: 1.00
### Key Observations
* The diagonal elements are all 1.00, indicating perfect coverage when comparing a method to itself.
* Repeated Sampling C generally shows high coverage scores with other methods, particularly with Direct Generation PC (0.91), Direct Generation P (0.89), Direct Generation C (0.89), Repeated Sampling P (0.87), Refinement C (0.87), and Repeated Sampling PC (0.85).
* Direct Generation P, C, and PC have relatively lower coverage scores with Repeated Sampling C, Refinement C, and Refinement PC compared to Repeated Sampling P and Refinement P.
* The lowest coverage scores are generally observed between Direct Generation methods and Repeated Sampling or Refinement methods.
### Interpretation
The heatmap provides insights into the similarity and overlap between the outputs of different text generation methods. Higher coverage scores suggest that the methods produce similar outputs, while lower scores indicate more distinct outputs.
The high coverage of Repeated Sampling C with other methods suggests that it might generate outputs that are more representative or inclusive of the outputs from other methods. Conversely, the lower coverage between Direct Generation and other methods might indicate that Direct Generation produces more unique or specialized outputs.
The "P", "C", and "PC" suffixes likely refer to different configurations or parameters within each generation method. The differences in coverage scores between these configurations suggest that these parameters have a significant impact on the output of each method.
The model name "gpt-03-mini" indicates that these coverage scores are specific to this particular language model. The results might vary with different models or datasets.
DECODING INTELLIGENCE...
EXPERT: nemotron-free VERSION 1
RUNTIME: free/nvidia/nemotron-nano-12b-v2-vl:free
INTEL_VERIFIED
# Technical Document: Coverage Comparison Across Methods and Models
## Image Description
The image is a **heatmap** visualizing coverage values across different **methods** (rows) and **models** (columns). The color intensity corresponds to coverage values, with darker red indicating higher coverage (closer to 1.0) and lighter red indicating lower coverage (closer to 0.0). The legend on the right maps colors to numerical values.
---
## Key Components
### 1. **Axis Labels**
- **X-axis (Models)**:
`gpt-o3-mini`, `gpt-o3-medium`, `gpt-o3-large`
- **Y-axis (Methods)**:
`Direct Generation P`, `Direct Generation C`, `Direct Generation PC`,
`Repeated Sampling P`, `Repeated Sampling C`, `Repeated Sampling PC`,
`Refinement P`, `Refinement C`, `Refinement PC`
- **Title**: `Coverage Comparison Across Methods and Models`
### 2. **Legend**
- **Location**: Right side of the heatmap.
- **Color Scale**:
- `0.0` (lightest red) to `1.0` (darkest red).
- Intermediate values: `0.5`, `0.75`, `0.9`.
---
## Data Structure
The heatmap is a **9x3 matrix** (9 methods × 3 models). Each cell contains a numerical coverage value. Below is the reconstructed table:
| Method | gpt-o3-mini | gpt-o3-medium | gpt-o3-large |
|----------------------|-------------|---------------|--------------|
| Direct Generation P | 1.00 | 0.74 | 0.75 |
| Direct Generation C | 0.61 | 1.00 | 0.71 |
| Direct Generation PC | 0.69 | 0.79 | 1.00 |
| Repeated Sampling P | 0.68 | 0.71 | 0.68 |
| Repeated Sampling C | 0.55 | 0.67 | 0.62 |
| Repeated Sampling PC | 0.55 | 0.66 | 0.61 |
| Refinement P | 0.61 | 0.75 | 0.66 |
| Refinement C | 0.56 | 0.67 | 0.62 |
| Refinement PC | 0.59 | 0.67 | 0.69 |
---
## Trends and Observations
1. **Direct Generation P** consistently shows high coverage (1.00 for `gpt-o3-mini`, 0.74–0.89 for other models).
2. **Direct Generation C** and **PC** exhibit moderate coverage, with PC achieving 1.00 for `gpt-o3-large`.
3. **Repeated Sampling** methods generally have lower coverage (0.55–0.88), with `Repeated Sampling C` showing the lowest values.
4. **Refinement** methods demonstrate moderate-to-high coverage, with `Refinement PC` achieving 0.83 for `gpt-o3-large`.
5. **Color Consistency**:
- Dark red cells (e.g., 1.00) align with the legend's highest value.
- Lighter red cells (e.g., 0.55–0.62) match the legend's lower range.
---
## Spatial Grounding
- **Legend Position**: Right-aligned, vertically stacked.
- **X-axis Position**: Bottom of the heatmap.
- **Y-axis Position**: Left of the heatmap.
---
## Notes
- All values are in **English** and represent coverage percentages.
- No non-English text is present.
- The heatmap uses a **continuous color scale** without discrete categories.
This analysis confirms that the heatmap effectively compares coverage across methods and models, with `Direct Generation P` and `Refinement PC` showing the highest performance for `gpt-o3-large`.
DECODING INTELLIGENCE...