TECHNICAL ASSET FINGERPRINT
a4c984472ec7091218b05789
Click to view fullscreen
Press ESC or click to close
FOUND IN PAPERS
EXPERT: gemma-3-27b-it-free VERSION 1
RUNTIME: google-free/gemma-3-27b-it
INTEL_VERIFIED
## Heatmap: Coverage Comparison of Generation Methods
### Overview
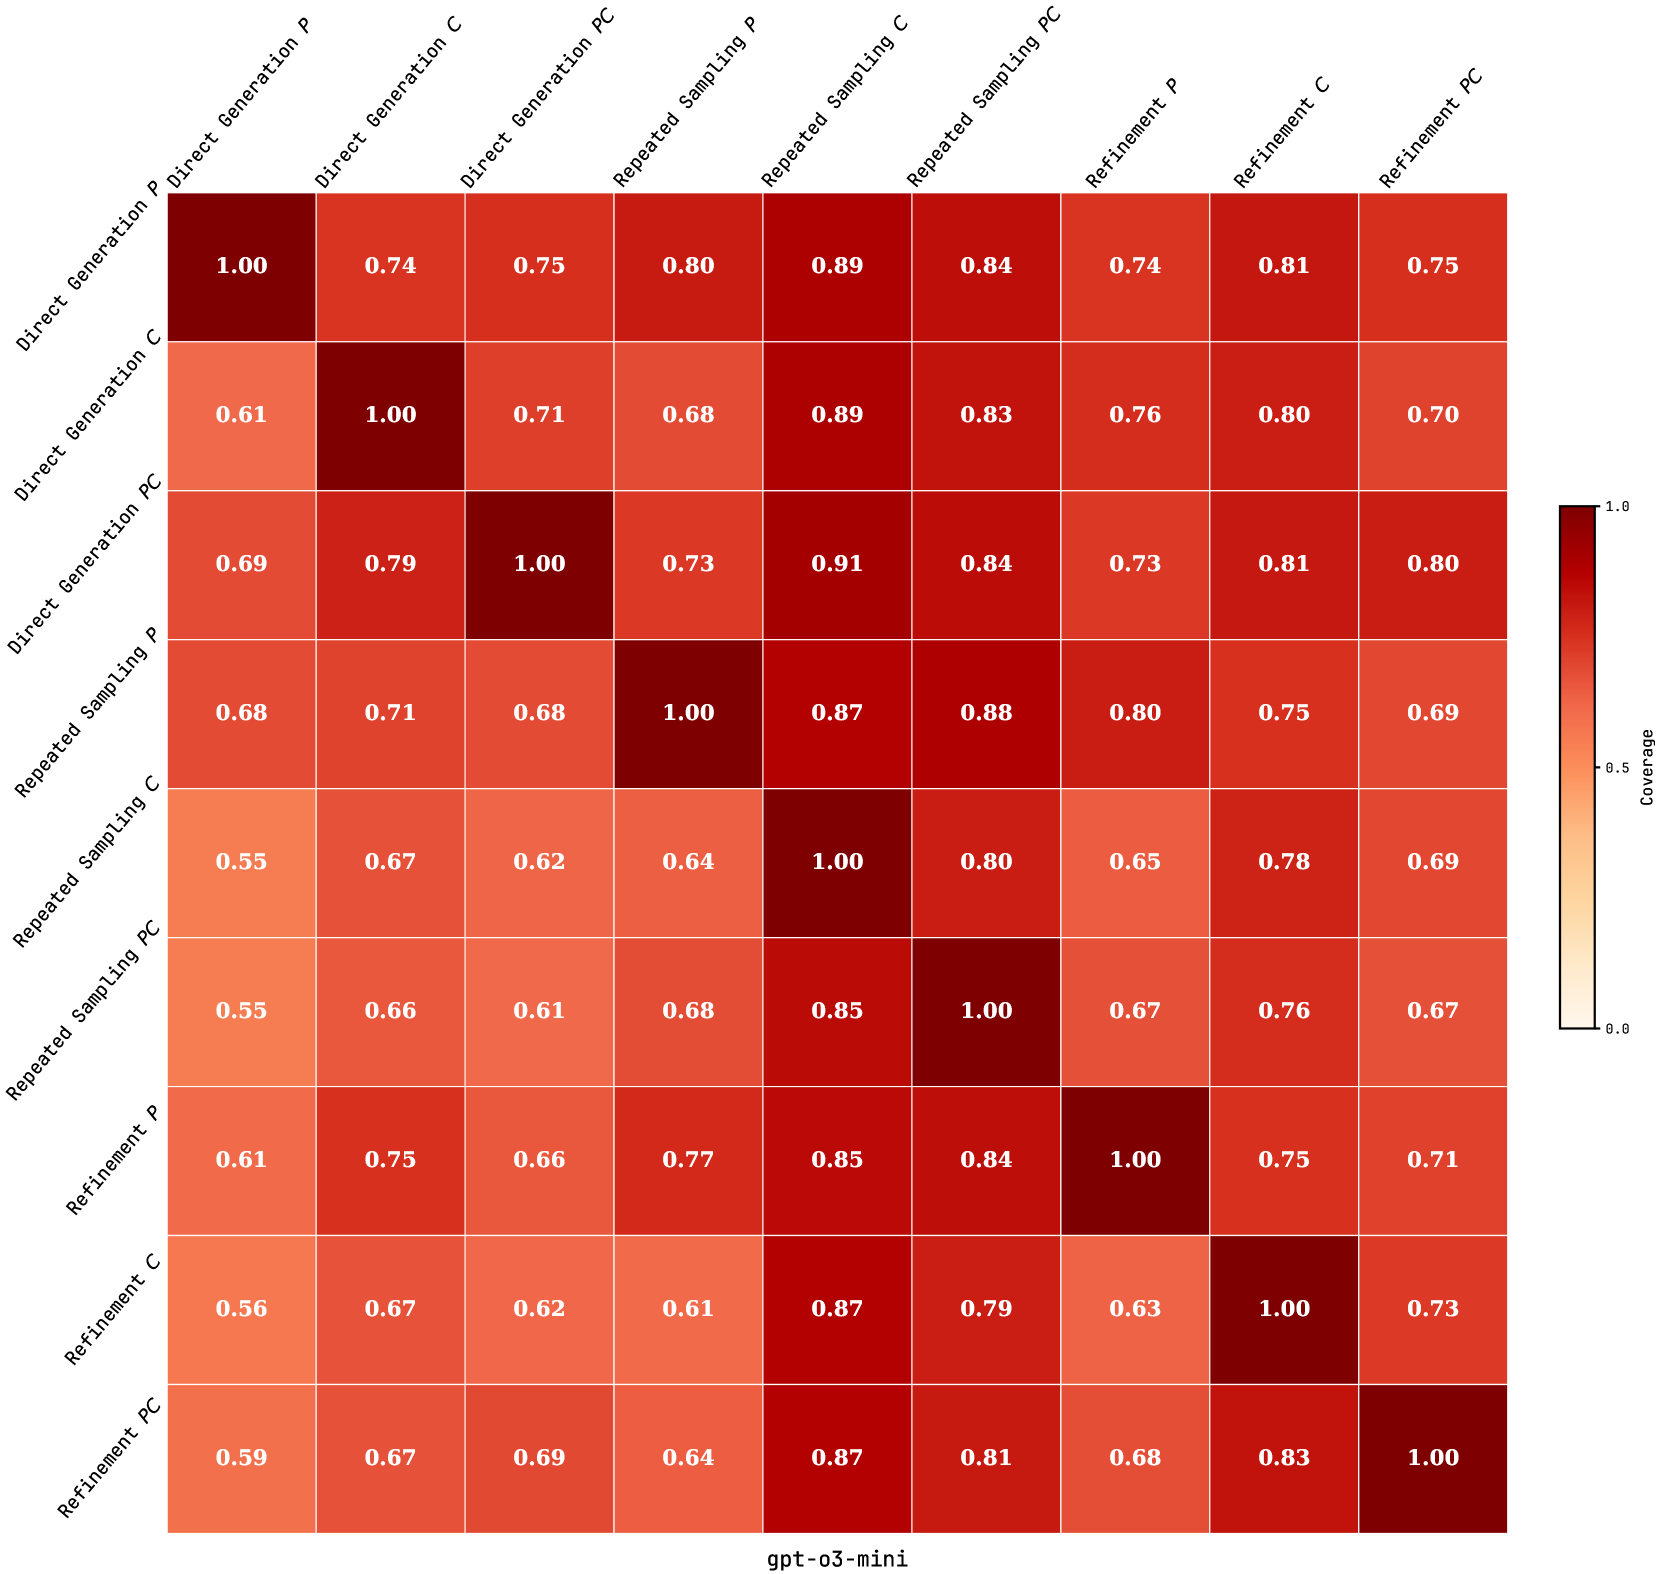
This image presents a heatmap visualizing the coverage comparison between different text generation methods. The methods are: Direct Generation (Prompt, Completion, and Principal Component), Repeated Sampling (Prompt, Completion, and Principal Component), and Refinement (Prompt, Completion, and Principal Component). The heatmap displays the correlation or similarity between these methods, with values ranging from 0 to 1, indicated by a color gradient.
### Components/Axes
* **X-axis:** Represents the generation methods: "Direct Generation\_P", "Direct Generation\_C", "Direct Generation\_PC", "Repeated Sampling\_P", "Repeated Sampling\_C", "Repeated Sampling\_PC", "Refinement\_P", "Refinement\_C", "Refinement\_PC".
* **Y-axis:** Represents the same generation methods as the X-axis, creating a matrix for pairwise comparison.
* **Color Scale (Right Side):** Indicates the "Coverage" value, ranging from approximately 0.0 (blue) to 1.8 (red). The scale is not linear, with a concentration of values between 0.5 and 1.0.
* **Cell Values:** Each cell in the heatmap displays a numerical value representing the coverage between the corresponding methods.
* **Title (Bottom):** "gpt-03-mini"
### Detailed Analysis
The heatmap is a 9x9 matrix. Each cell's color corresponds to the coverage value. The diagonal cells (where a method is compared to itself) all have a value of 1.00, indicating perfect coverage.
Here's a breakdown of the coverage values, row by row:
* **Direct Generation\_P:**
* Direct Generation\_P: 1.00
* Direct Generation\_C: 0.74
* Direct Generation\_PC: 0.75
* Repeated Sampling\_P: 0.80
* Repeated Sampling\_C: 0.89
* Repeated Sampling\_PC: 0.84
* Refinement\_P: 0.74
* Refinement\_C: 0.81
* Refinement\_PC: 0.75
* **Direct Generation\_C:**
* Direct Generation\_C: 1.00
* Direct Generation\_P: 0.61
* Direct Generation\_PC: 0.71
* Repeated Sampling\_P: 0.68
* Repeated Sampling\_C: 0.89
* Repeated Sampling\_PC: 0.83
* Refinement\_P: 0.76
* Refinement\_C: 0.80
* Refinement\_PC: 0.70
* **Direct Generation\_PC:**
* Direct Generation\_PC: 1.00
* Direct Generation\_P: 0.69
* Direct Generation\_C: 0.79
* Repeated Sampling\_P: 0.73
* Repeated Sampling\_C: 0.91
* Repeated Sampling\_PC: 0.84
* Refinement\_P: 0.73
* Refinement\_C: 0.81
* Refinement\_PC: 0.80
* **Repeated Sampling\_P:**
* Repeated Sampling\_P: 1.00
* Direct Generation\_P: 0.68
* Direct Generation\_C: 0.71
* Direct Generation\_PC: 0.68
* Repeated Sampling\_C: 0.87
* Repeated Sampling\_PC: 0.88
* Refinement\_P: 0.80
* Refinement\_C: 0.75
* Refinement\_PC: 0.69
* **Repeated Sampling\_C:**
* Repeated Sampling\_C: 1.00
* Direct Generation\_P: 0.55
* Direct Generation\_C: 0.67
* Direct Generation\_PC: 0.62
* Repeated Sampling\_P: 0.64
* Repeated Sampling\_PC: 0.80
* Refinement\_P: 0.65
* Refinement\_C: 0.78
* Refinement\_PC: 0.69
* **Repeated Sampling\_PC:**
* Repeated Sampling\_PC: 1.00
* Direct Generation\_P: 0.55
* Direct Generation\_C: 0.66
* Direct Generation\_PC: 0.61
* Repeated Sampling\_P: 0.68
* Repeated Sampling\_C: 0.85
* Refinement\_P: 0.76
* Refinement\_C: 0.67
* Refinement\_PC: 0.67
* **Refinement\_P:**
* Refinement\_P: 1.00
* Direct Generation\_P: 0.61
* Direct Generation\_C: 0.75
* Direct Generation\_PC: 0.66
* Repeated Sampling\_P: 0.77
* Repeated Sampling\_C: 0.85
* Repeated Sampling\_PC: 0.84
* Refinement\_C: 0.75
* Refinement\_PC: 0.71
* **Refinement\_C:**
* Refinement\_C: 1.00
* Direct Generation\_P: 0.56
* Direct Generation\_C: 0.67
* Direct Generation\_PC: 0.62
* Repeated Sampling\_P: 0.61
* Repeated Sampling\_C: 0.87
* Repeated Sampling\_PC: 0.79
* Refinement\_P: 0.63
* Refinement\_PC: 0.73
* **Refinement\_PC:**
* Refinement\_PC: 1.00
* Direct Generation\_P: 0.59
* Direct Generation\_C: 0.69
* Direct Generation\_PC: 0.64
* Repeated Sampling\_P: 0.87
* Repeated Sampling\_C: 0.81
* Repeated Sampling\_PC: 0.68
* Refinement\_P: 0.83
* Refinement\_PC: 1.00
### Key Observations
* The diagonal elements are all 1.00, as expected.
* "Repeated Sampling\_C" and "Refinement\_C" consistently show higher coverage values with other methods compared to their "P" and "PC" counterparts.
* "Direct Generation\_P" and "Refinement\_P" generally have lower coverage values with other methods.
* The highest off-diagonal value is 0.91, between "Direct Generation\_PC" and "Repeated Sampling\_C".
* The lowest off-diagonal value is 0.55, appearing twice between "Repeated Sampling\_C" and "Direct Generation\_P", and between "Repeated Sampling\_PC" and "Direct Generation\_P".
### Interpretation
This heatmap demonstrates the degree of overlap or similarity in the outputs generated by different text generation methods. The "Coverage" metric likely represents how much of the output from one method is also present in the output of another.
The higher coverage values between methods ending in "\_C" (Completion) suggest that the completion-based approaches are more consistent and share more common ground with other methods. Conversely, the lower coverage values associated with methods ending in "\_P" (Prompt) indicate that prompt-based approaches may be more diverse or generate more unique outputs.
The relatively low coverage between "Direct Generation\_P" and the "Repeated Sampling" and "Refinement" methods suggests that direct prompting leads to significantly different results compared to iterative sampling or refinement techniques. This could be due to the prompt's sensitivity or the inherent randomness in the sampling/refinement processes.
The "gpt-03-mini" label suggests this data is specific to a particular language model. The heatmap provides valuable insights into the characteristics of different generation strategies within this model, which can inform the selection of the most appropriate method for a given task. The data suggests that for tasks requiring consistency and overlap with other generation methods, completion-based approaches are preferable. For tasks prioritizing diversity and uniqueness, prompt-based approaches may be more suitable.
DECODING INTELLIGENCE...