## Heatmap: Coverage Correlation Matrix for gpt-o3-mini
### Overview
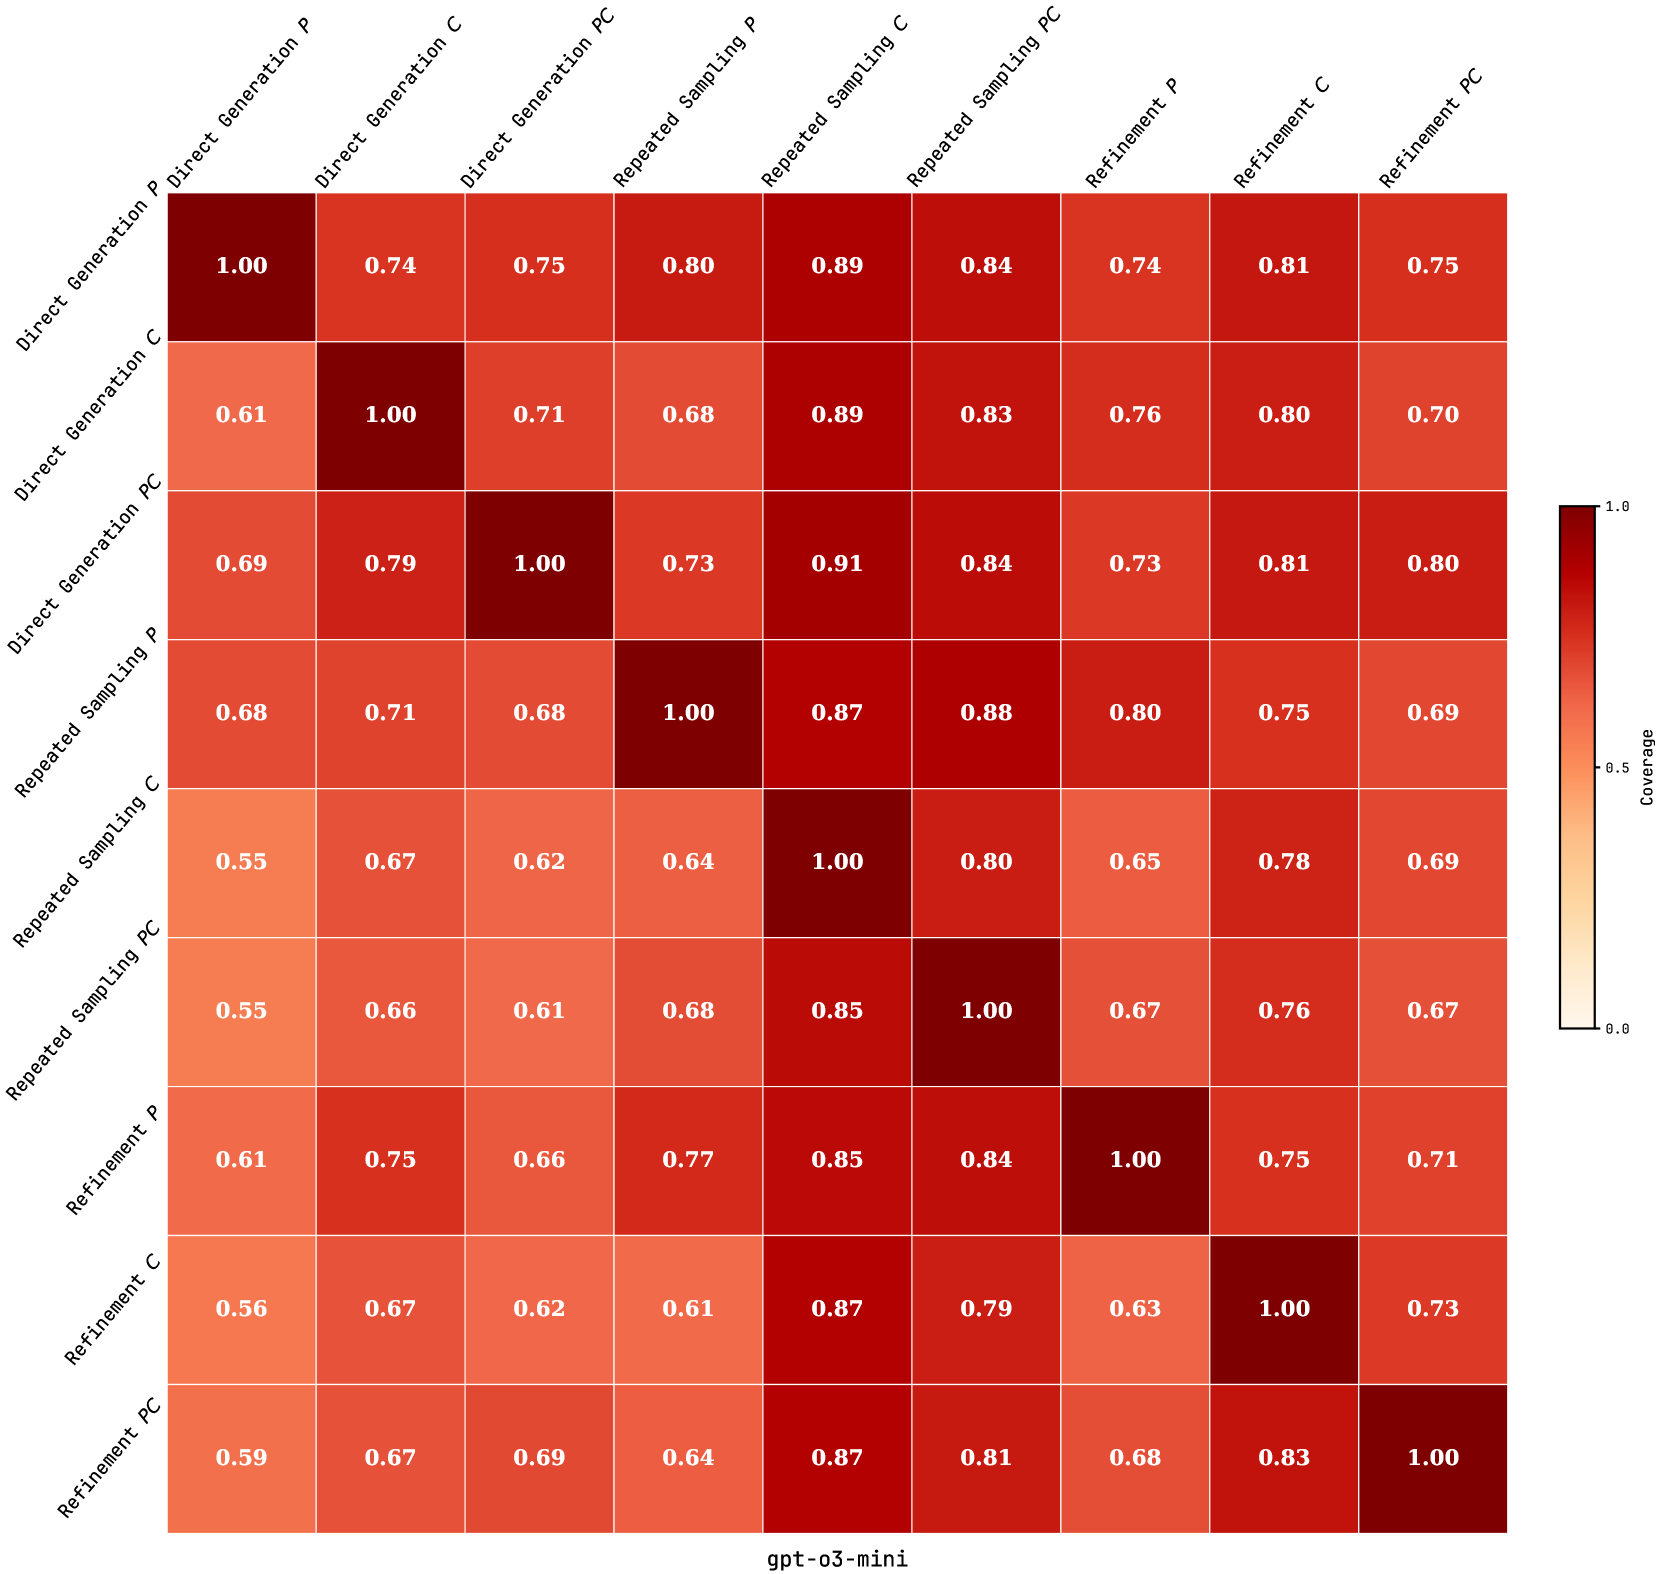
The image is a 9x9 heatmap displaying numerical "Coverage" values between different methodological approaches. The chart is titled "gpt-o3-mini" at the bottom center. The data is presented as a symmetric matrix where each cell's color intensity (from light orange to dark red) corresponds to a coverage value between 0.0 and 1.0, as indicated by a vertical color bar legend on the right side.
### Components/Axes
* **Chart Type:** Heatmap (Correlation/Similarity Matrix).
* **Title/Label:** "gpt-o3-mini" (located at the bottom center of the chart).
* **X-Axis (Top):** Labels are rotated 45 degrees. From left to right:
1. Direct Generation P
2. Direct Generation C
3. Direct Generation PC
4. Repeated Sampling P
5. Repeated Sampling C
6. Repeated Sampling PC
7. Refinement P
8. Refinement C
9. Refinement PC
* **Y-Axis (Left):** Labels are rotated 45 degrees. From top to bottom:
1. Direct Generation P
2. Direct Generation C
3. Direct Generation PC
4. Repeated Sampling P
5. Repeated Sampling C
6. Repeated Sampling PC
7. Refinement P
8. Refinement C
9. Refinement PC
* **Legend (Right Side):** A vertical color bar labeled "Coverage". The scale runs from 0.0 (lightest orange/cream) at the bottom to 1.0 (darkest red) at the top, with a midpoint marker at 0.5.
* **Data Cells:** Each cell in the 9x9 grid contains a numerical value (to two decimal places) representing the coverage between the row method and the column method. The diagonal cells (where row and column are identical) all have a value of 1.00 and are the darkest red.
### Detailed Analysis
The matrix is symmetric (e.g., value at [Row: Direct Generation C, Column: Direct Generation P] is 0.61, and at [Row: Direct Generation P, Column: Direct Generation C] is 0.74). The following table reconstructs the full data matrix. Values are read directly from the cells.
| Row \ Column | Direct Generation P | Direct Generation C | Direct Generation PC | Repeated Sampling P | Repeated Sampling C | Repeated Sampling PC | Refinement P | Refinement C | Refinement PC |
| :--- | :---: | :---: | :---: | :---: | :---: | :---: | :---: | :---: | :---: |
| **Direct Generation P** | **1.00** | 0.74 | 0.75 | 0.80 | 0.89 | 0.84 | 0.74 | 0.81 | 0.75 |
| **Direct Generation C** | 0.61 | **1.00** | 0.71 | 0.68 | 0.89 | 0.83 | 0.76 | 0.80 | 0.70 |
| **Direct Generation PC** | 0.69 | 0.79 | **1.00** | 0.73 | 0.91 | 0.84 | 0.73 | 0.81 | 0.80 |
| **Repeated Sampling P** | 0.68 | 0.71 | 0.68 | **1.00** | 0.87 | 0.88 | 0.80 | 0.75 | 0.69 |
| **Repeated Sampling C** | 0.55 | 0.67 | 0.62 | 0.64 | **1.00** | 0.80 | 0.65 | 0.78 | 0.69 |
| **Repeated Sampling PC** | 0.55 | 0.66 | 0.61 | 0.68 | 0.85 | **1.00** | 0.67 | 0.76 | 0.67 |
| **Refinement P** | 0.61 | 0.75 | 0.66 | 0.77 | 0.85 | 0.84 | **1.00** | 0.75 | 0.71 |
| **Refinement C** | 0.56 | 0.67 | 0.62 | 0.61 | 0.87 | 0.79 | 0.63 | **1.00** | 0.73 |
| **Refinement PC** | 0.59 | 0.67 | 0.69 | 0.64 | 0.87 | 0.81 | 0.68 | 0.83 | **1.00** |
### Key Observations
1. **Diagonal Perfection:** All diagonal cells (self-comparison) have a coverage of 1.00, forming a dark red line from top-left to bottom-right.
2. **Highest Off-Diagonal Values:** The highest coverage values outside the diagonal are found in the "Repeated Sampling C" column, particularly when intersected with "Direct Generation PC" (0.91) and "Direct Generation P" (0.89). This suggests strong coverage overlap between these specific method pairs.
3. **Lowest Values:** The lowest coverage values (0.55) occur in the "Repeated Sampling C" and "Repeated Sampling PC" rows when compared against "Direct Generation P". This indicates the weakest coverage relationship in the matrix.
4. **Method Grouping Patterns:**
* Methods within the same family (e.g., all "Direct Generation" variants) generally show moderate to high coverage with each other (values typically >0.70).
* The "Repeated Sampling" methods show particularly high internal coverage (e.g., Repeated Sampling C vs. Repeated Sampling PC = 0.80).
* Coverage between "Refinement" methods and "Direct Generation" methods tends to be lower (often in the 0.55-0.75 range) compared to coverage within the "Repeated Sampling" family.
5. **Color-Value Consistency:** The color gradient accurately reflects the numerical values. Cells with values near 1.0 are dark red, values near 0.5 are medium orange, and values near 0.0 would be light cream (though no values below 0.55 are present).
### Interpretation
This heatmap quantifies the "Coverage" relationship between nine different methodological approaches for the `gpt-o3-mini` model. "Coverage" likely measures the degree of overlap, similarity, or agreement in the outputs or capabilities of these methods.
* **What the data suggests:** The matrix reveals a hierarchy of methodological similarity. The "Repeated Sampling" family (especially the 'C' variant) appears to be a central, highly interconnected hub, showing strong coverage with most other methods. "Direct Generation" methods form another cluster. "Refinement" methods, while internally consistent, show weaker coverage links to the "Direct Generation" approaches.
* **How elements relate:** The symmetric nature confirms that the coverage metric is mutual. The high values between "Repeated Sampling C" and "Direct Generation PC" (0.91) are a key finding, suggesting these two distinct approaches yield highly overlapping results. Conversely, the low values between "Repeated Sampling" methods and "Direct Generation P" (0.55) highlight a significant divergence in what these methods cover.
* **Notable anomalies/trends:** The most striking trend is the central role of "Repeated Sampling C," which has the highest average coverage with other methods. An anomaly is the relatively low coverage (0.61) between the two most basic methods: "Direct Generation C" and "Direct Generation P," suggesting their outputs are quite distinct despite sharing a common high-level approach. The "PC" variants (likely meaning "Prompt + Chain-of-thought" or similar) generally show higher coverage with other methods than their "P" or "C" counterparts alone, indicating a more comprehensive or overlapping coverage profile.