## Diagram: Human Pose Decomposition and Representation
### Overview
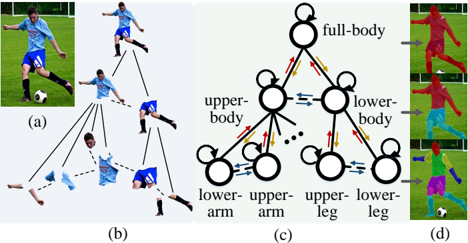
The image presents a diagram illustrating a hierarchical decomposition of human pose, likely for the purpose of action recognition or animation. It shows a sequence of images (a, b, d) depicting a soccer player in different poses, alongside a hierarchical graph (c) representing the relationships between body parts.
### Components/Axes
The image is divided into four main sections:
* **(a)**: A single image of a soccer player kicking a ball.
* **(b)**: A sequence of four images showing the same soccer player in different stages of the kicking motion, with lines connecting corresponding body parts across the images.
* **(c)**: A hierarchical graph representing the body part relationships. Nodes represent body parts (full-body, upper-body, lower-body, upper-arm, lower-arm, upper-leg, lower-leg), and arrows indicate dependencies or influences.
* **(d)**: Three images of a soccer player in different poses, each highlighted with a different color representing a specific body part or group of body parts.
The graph (c) uses the following labels:
* "full-body"
* "upper-body"
* "lower-body"
* "upper-arm"
* "lower-arm"
* "upper-leg"
* "lower-leg"
The arrows in the graph (c) are:
* Solid orange arrows: Representing a strong influence or dependency.
* Dotted black arrows: Representing a weaker or less direct influence.
* Blue bidirectional arrows: Representing reciprocal influence or interaction.
### Detailed Analysis or Content Details
**(a)**: Shows a soccer player in mid-kick, with the right leg extended towards the ball. The player is wearing a light blue jersey, black shorts, and black socks.
**(b)**: This section shows a time sequence of the kick. The images are arranged in a cascading manner, with the first image at the top-center and the last at the bottom-center. Lines connect corresponding body parts across the images, illustrating the motion. The lines are white and point from the earlier pose to the later pose.
**(c)**: The hierarchical graph shows the following relationships:
* "full-body" is the root node.
* "full-body" has two child nodes: "upper-body" and "lower-body".
* "upper-body" has two child nodes: "upper-arm" and "lower-arm".
* "lower-body" has two child nodes: "upper-leg" and "lower-leg".
* There are bidirectional blue arrows between "upper-arm" and "lower-arm", and between "upper-leg" and "lower-leg".
* There are solid orange arrows from "upper-body" to "upper-arm" and "lower-arm", and from "lower-body" to "upper-leg" and "lower-leg".
* There are dotted black arrows from "upper-arm" to "lower-body" and from "lower-leg" to "upper-body".
**(d)**: This section shows three different poses of the soccer player, each highlighted with a different color:
* Top image: Highlighted in magenta, focusing on the upper body and head.
* Middle image: Highlighted in teal, focusing on the lower body and legs.
* Bottom image: Highlighted in green, focusing on the lower body and legs.
### Key Observations
* The diagram emphasizes a hierarchical structure for representing human pose, breaking down the body into increasingly smaller parts.
* The graph (c) suggests that the upper and lower body are relatively independent, but there are also interactions between them.
* The time sequence in (b) illustrates the dynamic changes in pose during the kicking motion.
* The color-coding in (d) highlights specific body parts or groups of body parts, potentially for visualization or analysis.
### Interpretation
The diagram demonstrates a method for representing human pose in a structured and hierarchical manner. This approach is likely used in computer vision and robotics applications, such as action recognition, motion capture, and animation. The hierarchical decomposition allows for a more efficient and flexible representation of complex human movements. The graph (c) captures the dependencies between body parts, which can be used to constrain the motion and ensure realistic movements. The time sequence in (b) provides a visual example of how the pose changes over time, and the color-coding in (d) allows for a clear visualization of specific body parts. The dotted lines in the graph suggest that there are less direct influences between the upper and lower body, while the solid lines indicate stronger dependencies. The bidirectional arrows suggest that the upper and lower arms/legs interact with each other. This representation could be used to build a model that can predict or generate human movements based on a given set of constraints.