## Line Chart: Accuracy vs. Epochs for Different Methods
### Overview
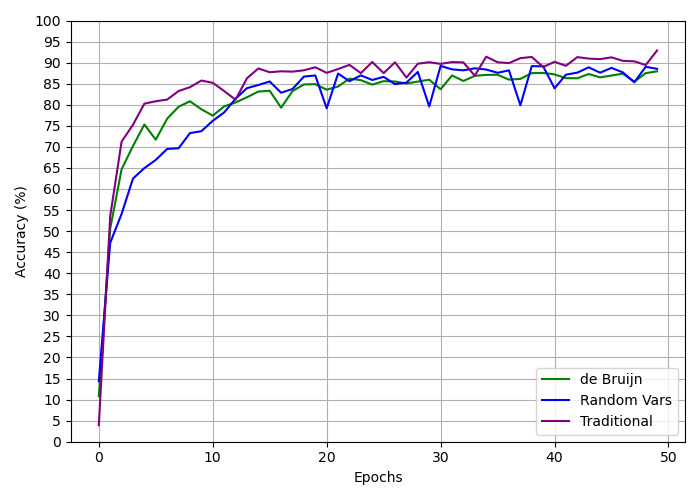
The image is a line chart comparing the accuracy of three different methods ("de Bruijn", "Random Vars", and "Traditional") over 50 epochs. The chart displays accuracy (in percentage) on the y-axis and epochs on the x-axis.
### Components/Axes
* **Title:** There is no explicit title on the chart.
* **X-axis:**
* Label: "Epochs"
* Scale: 0 to 50, with tick marks at intervals of 10 (0, 10, 20, 30, 40, 50).
* **Y-axis:**
* Label: "Accuracy (%)"
* Scale: 0 to 100, with tick marks at intervals of 5 (0, 5, 10, ..., 100).
* **Legend:** Located in the bottom-right corner.
* "de Bruijn" - Green line
* "Random Vars" - Dark Blue line
* "Traditional" - Purple line
### Detailed Analysis
* **"de Bruijn" (Green Line):**
* Trend: Initially increases rapidly, then plateaus around 85-90% after approximately 20 epochs.
* Data Points:
* Epoch 0: ~15%
* Epoch 10: ~80%
* Epoch 20: ~85%
* Epoch 30: ~85%
* Epoch 40: ~88%
* Epoch 50: ~88%
* **"Random Vars" (Dark Blue Line):**
* Trend: Initially increases rapidly, then plateaus around 85-90% after approximately 30 epochs. Shows more fluctuation than the other two methods.
* Data Points:
* Epoch 0: ~10%
* Epoch 10: ~75%
* Epoch 20: ~85%
* Epoch 30: ~80%
* Epoch 40: ~80%
* Epoch 50: ~85%
* **"Traditional" (Purple Line):**
* Trend: Initially increases rapidly, then plateaus around 85-90% after approximately 15 epochs.
* Data Points:
* Epoch 0: ~5%
* Epoch 10: ~80%
* Epoch 20: ~90%
* Epoch 30: ~90%
* Epoch 40: ~90%
* Epoch 50: ~90%
### Key Observations
* All three methods show a rapid increase in accuracy during the initial epochs.
* The "Traditional" method appears to reach a stable accuracy level slightly faster than the other two.
* The "Random Vars" method exhibits more fluctuation in accuracy compared to the other two methods after reaching its plateau.
* All three methods converge to a similar accuracy range (85-90%) after a certain number of epochs.
### Interpretation
The chart suggests that all three methods are effective in achieving high accuracy, but they differ in their convergence speed and stability. The "Traditional" method might be preferred if a faster convergence is desired, while the "de Bruijn" method appears to be more stable than "Random Vars" after convergence. The choice of method may depend on the specific application and the trade-off between convergence speed and stability.