## Line Graph: Accuracy vs. Epochs for Different Methods
### Overview
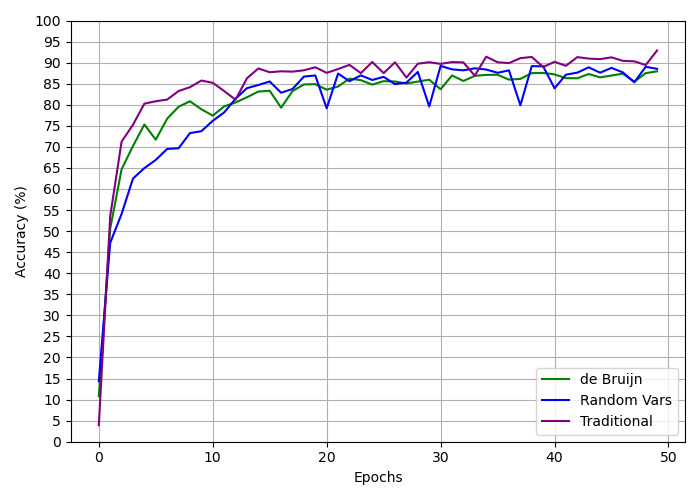
The image is a line graph comparing the accuracy (%) of three methods—**de Bruijn**, **Random Vars**, and **Traditional**—over 50 epochs. All three lines show an upward trend in accuracy, with convergence toward higher values as epochs increase. The graph includes a legend, axis labels, and gridlines for reference.
---
### Components/Axes
- **X-axis (Epochs)**: Labeled "Epochs," ranging from 0 to 50 in increments of 10.
- **Y-axis (Accuracy %)**: Labeled "Accuracy (%)", ranging from 0 to 100 in increments of 5.
- **Legend**: Located in the **bottom-right corner**, with color-coded labels:
- **Green**: de Bruijn
- **Blue**: Random Vars
- **Purple**: Traditional
- **Gridlines**: Horizontal and vertical gridlines divide the plot into 1% and 1-epoch increments.
---
### Detailed Analysis
1. **de Bruijn (Green Line)**:
- Starts at ~10% accuracy at epoch 0.
- Sharp rise to ~75% by epoch 5, followed by gradual stabilization.
- Fluctuates slightly between 80–90% after epoch 10, ending near 88% at epoch 50.
2. **Random Vars (Blue Line)**:
- Starts at ~15% accuracy at epoch 0.
- Rapid increase to ~80% by epoch 10, with notable volatility (e.g., dips to ~75% at epoch 20).
- Stabilizes between 85–90% after epoch 25, ending near 89% at epoch 50.
3. **Traditional (Purple Line)**:
- Starts at ~5% accuracy at epoch 0.
- Slow initial rise to ~70% by epoch 10, followed by accelerated growth.
- Peaks at ~92% by epoch 35, then fluctuates between 88–93% until epoch 50.
---
### Key Observations
- **Initial Disparity**: At epoch 0, Traditional has the lowest accuracy (~5%), while Random Vars starts highest (~15%).
- **Convergence**: By epoch 30, all lines cluster between 85–90%, indicating similar performance in later stages.
- **Volatility**: Random Vars exhibits the most fluctuation (e.g., sharp dips at epochs 20 and 35), while Traditional and de Bruijn show smoother trends.
- **Final Performance**: Traditional achieves the highest accuracy (~93%) by epoch 50, followed by de Bruijn (~88%) and Random Vars (~89%).
---
### Interpretation
The data suggests that all three methods improve accuracy with increased training epochs, but their learning curves differ:
- **Traditional** starts slow but outperforms others in the long run, possibly due to a more stable optimization process.
- **de Bruijn** achieves rapid early gains but plateaus earlier, suggesting diminishing returns after epoch 10.
- **Random Vars** shows high variability, potentially due to stochastic elements in its design, leading to less consistent performance.
The convergence of lines after epoch 10 implies that all methods reach a similar "ceiling" in accuracy, though Traditional maintains a slight edge. The fluctuations in Random Vars highlight the trade-off between exploration (via randomness) and stability in model training.