## Heatmap: Syllogism Format vs. Language Categories
### Overview
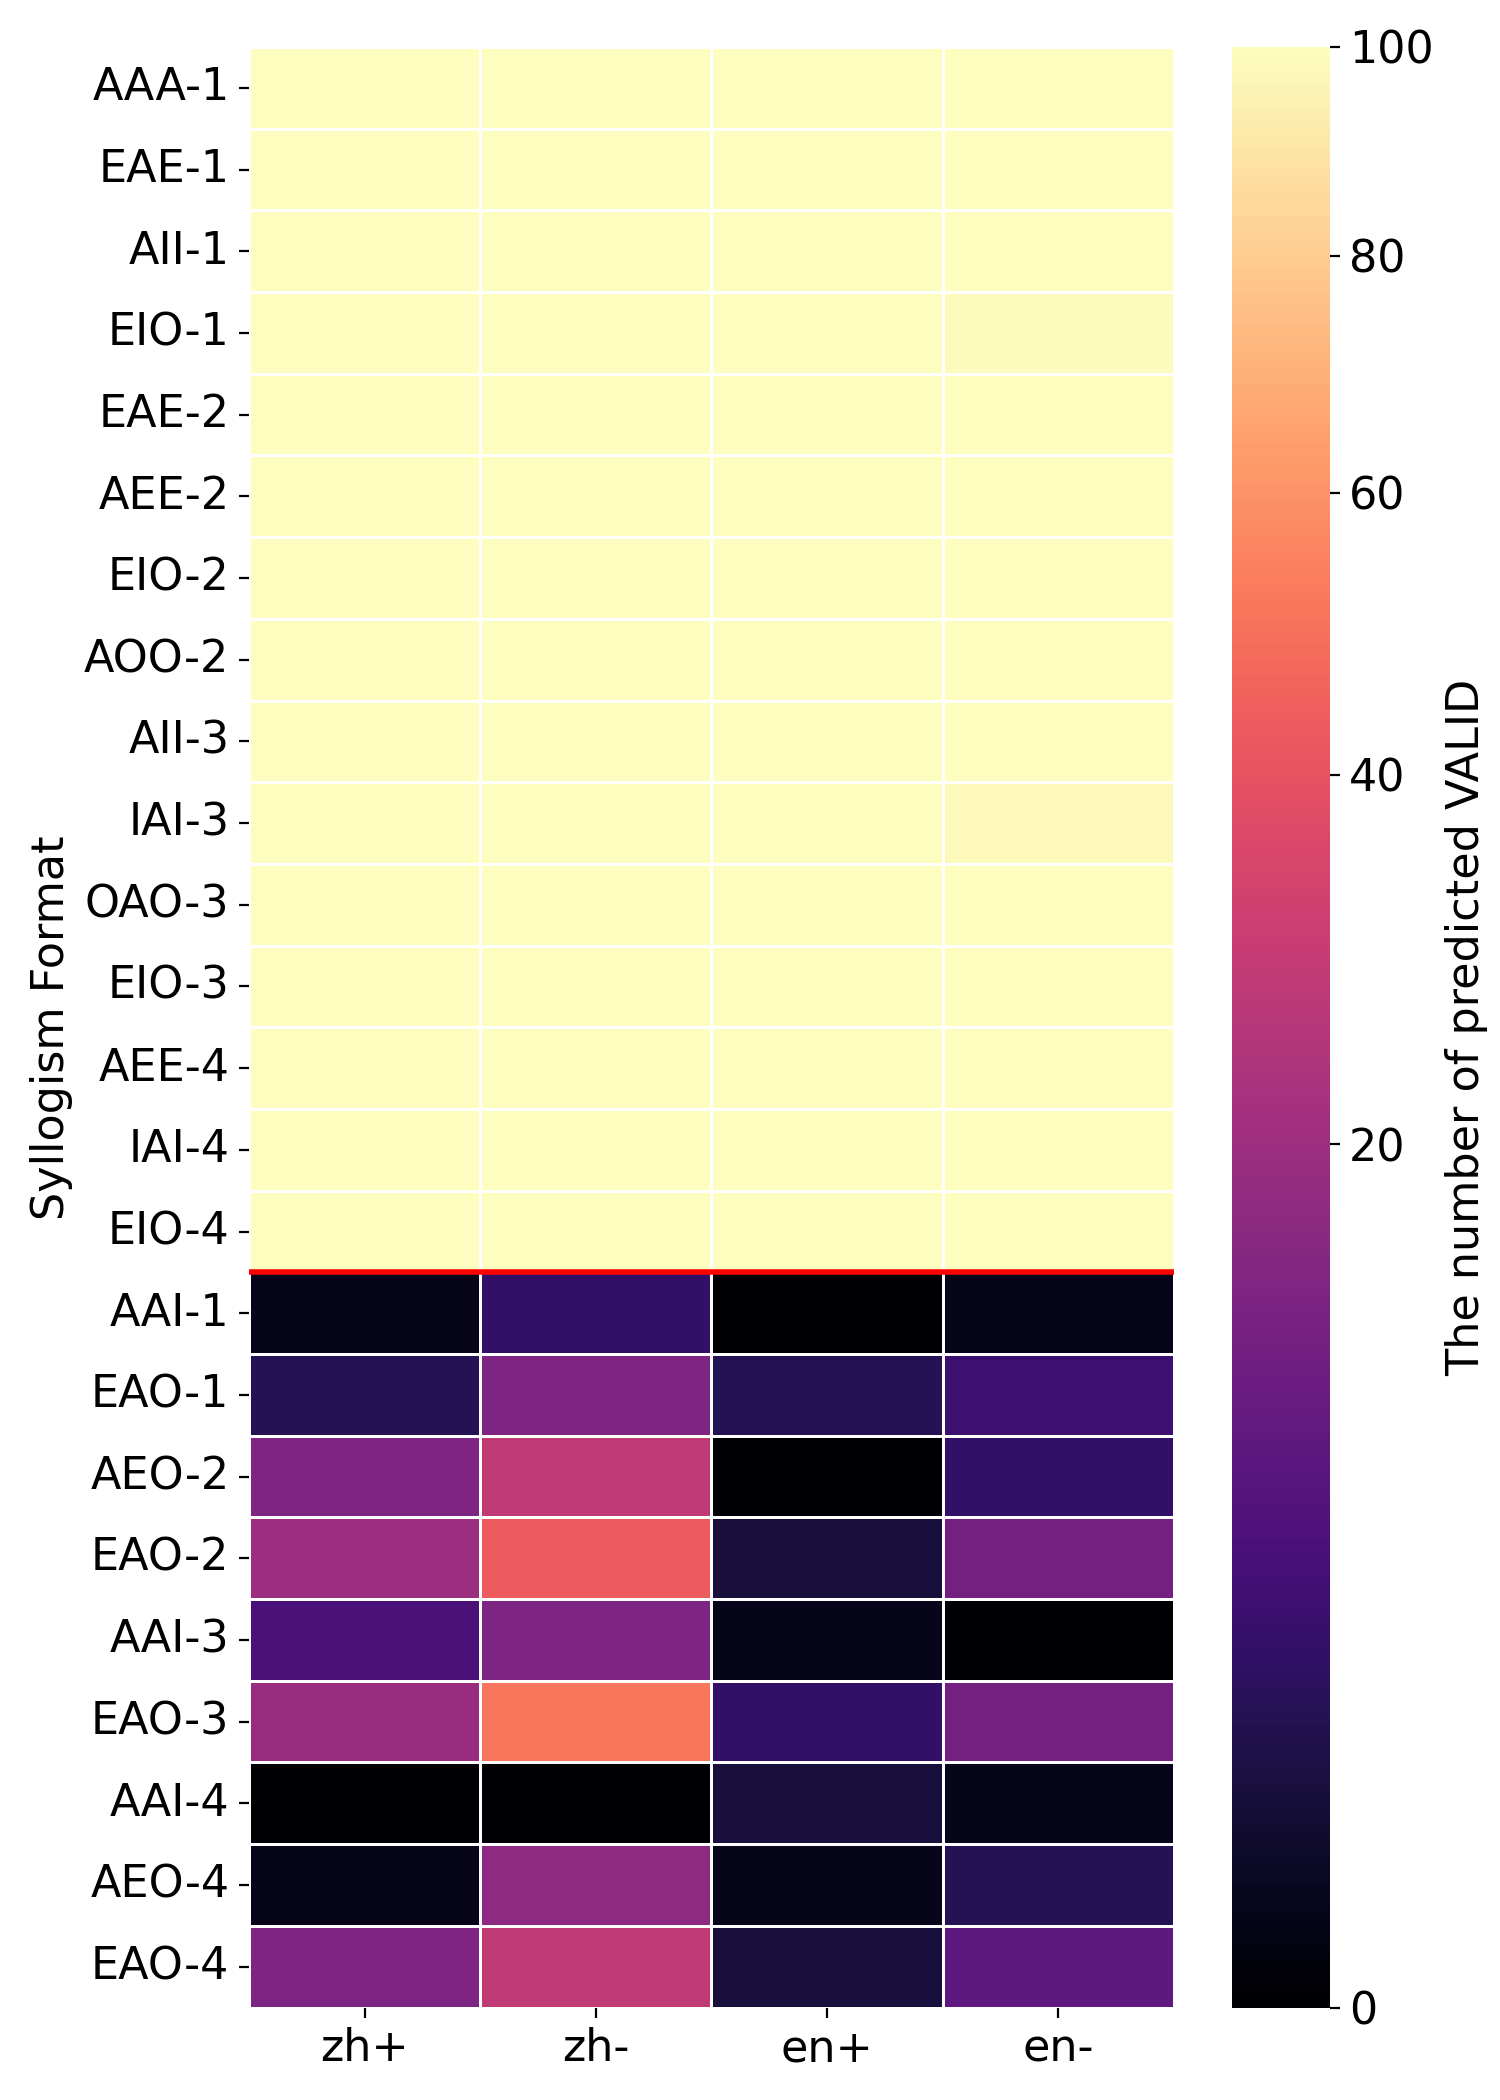
The image is a heatmap visualizing the relationship between syllogism formats (y-axis) and language categories (x-axis: zh+, zh-, en+, en-). Color intensity represents the number of predicted VALID outcomes, ranging from 0 (black) to 100 (yellow). A red horizontal line separates the top and bottom halves of the chart.
### Components/Axes
- **Y-Axis (Syllogism Format)**:
- Categories: AAA-1, EAE-1, AII-1, EIO-1, EAE-2, AEE-2, EIO-2, AOO-2, AII-3, IAI-3, OAO-3, EIO-3, AEE-4, IAI-4, EIO-4 (top to bottom).
- **X-Axis (Language Categories)**:
- Categories: zh+, zh-, en+, en- (left to right).
- **Color Legend**:
- Scale: 0 (black) to 100 (yellow), labeled "The number of predicted VALID."
- Red line at the midpoint (y-axis) separates high and low-value regions.
### Detailed Analysis
- **Top Half (Above Red Line)**:
- All cells are uniformly yellow (≈100), indicating maximum predicted VALID for all combinations in this region.
- **Bottom Half (Below Red Line)**:
- **EAO-2**:
- zh+: ≈20 (light purple), zh-: ≈60 (orange), en+: ≈0 (black), en-: ≈10 (dark purple).
- **EAO-3**:
- zh+: ≈20 (light purple), zh-: ≈60 (orange), en+: ≈0 (black), en-: ≈10 (dark purple).
- **EAO-4**:
- zh+: ≈0 (black), zh-: ≈20 (light purple), en+: ≈0 (black), en-: ≈10 (dark purple).
- **Other Bottom Rows**:
- Values cluster between 0 (black) and 20 (light purple), with occasional orange (≈60) in zh- categories.
### Key Observations
1. **High-Value Region**: The top half (above the red line) shows perfect prediction (100% VALID) across all syllogism formats and language categories.
2. **Low-Value Region**: The bottom half exhibits sparse VALID predictions, with most cells near 0 (black) or 10-20 (purple/orange).
3. **Red Line Significance**: The red line likely represents a threshold (e.g., 50% VALID), dividing high-confidence and low-confidence predictions.
4. **Language-Specific Trends**:
- zh- categories (e.g., EAO-2, EAO-3) show higher VALID predictions (≈60) compared to zh+ (≈20) and en+ (≈0).
- en- consistently shows low VALID predictions (≈10) across most syllogism formats.
### Interpretation
The heatmap suggests that syllogism formats in the top half (e.g., AAA-1, EAE-1) are universally predicted as VALID, possibly due to structural simplicity or alignment with training data. In contrast, formats in the bottom half (e.g., EAO-2, EAO-4) exhibit language-dependent performance, with zh- categories outperforming others. The red line may indicate a critical cutoff for model confidence, beyond which predictions become unreliable. The stark contrast between high and low regions implies potential biases in the model’s handling of complex syllogisms or non-native language structures.