## Diagram: Metrics Categorization
### Overview
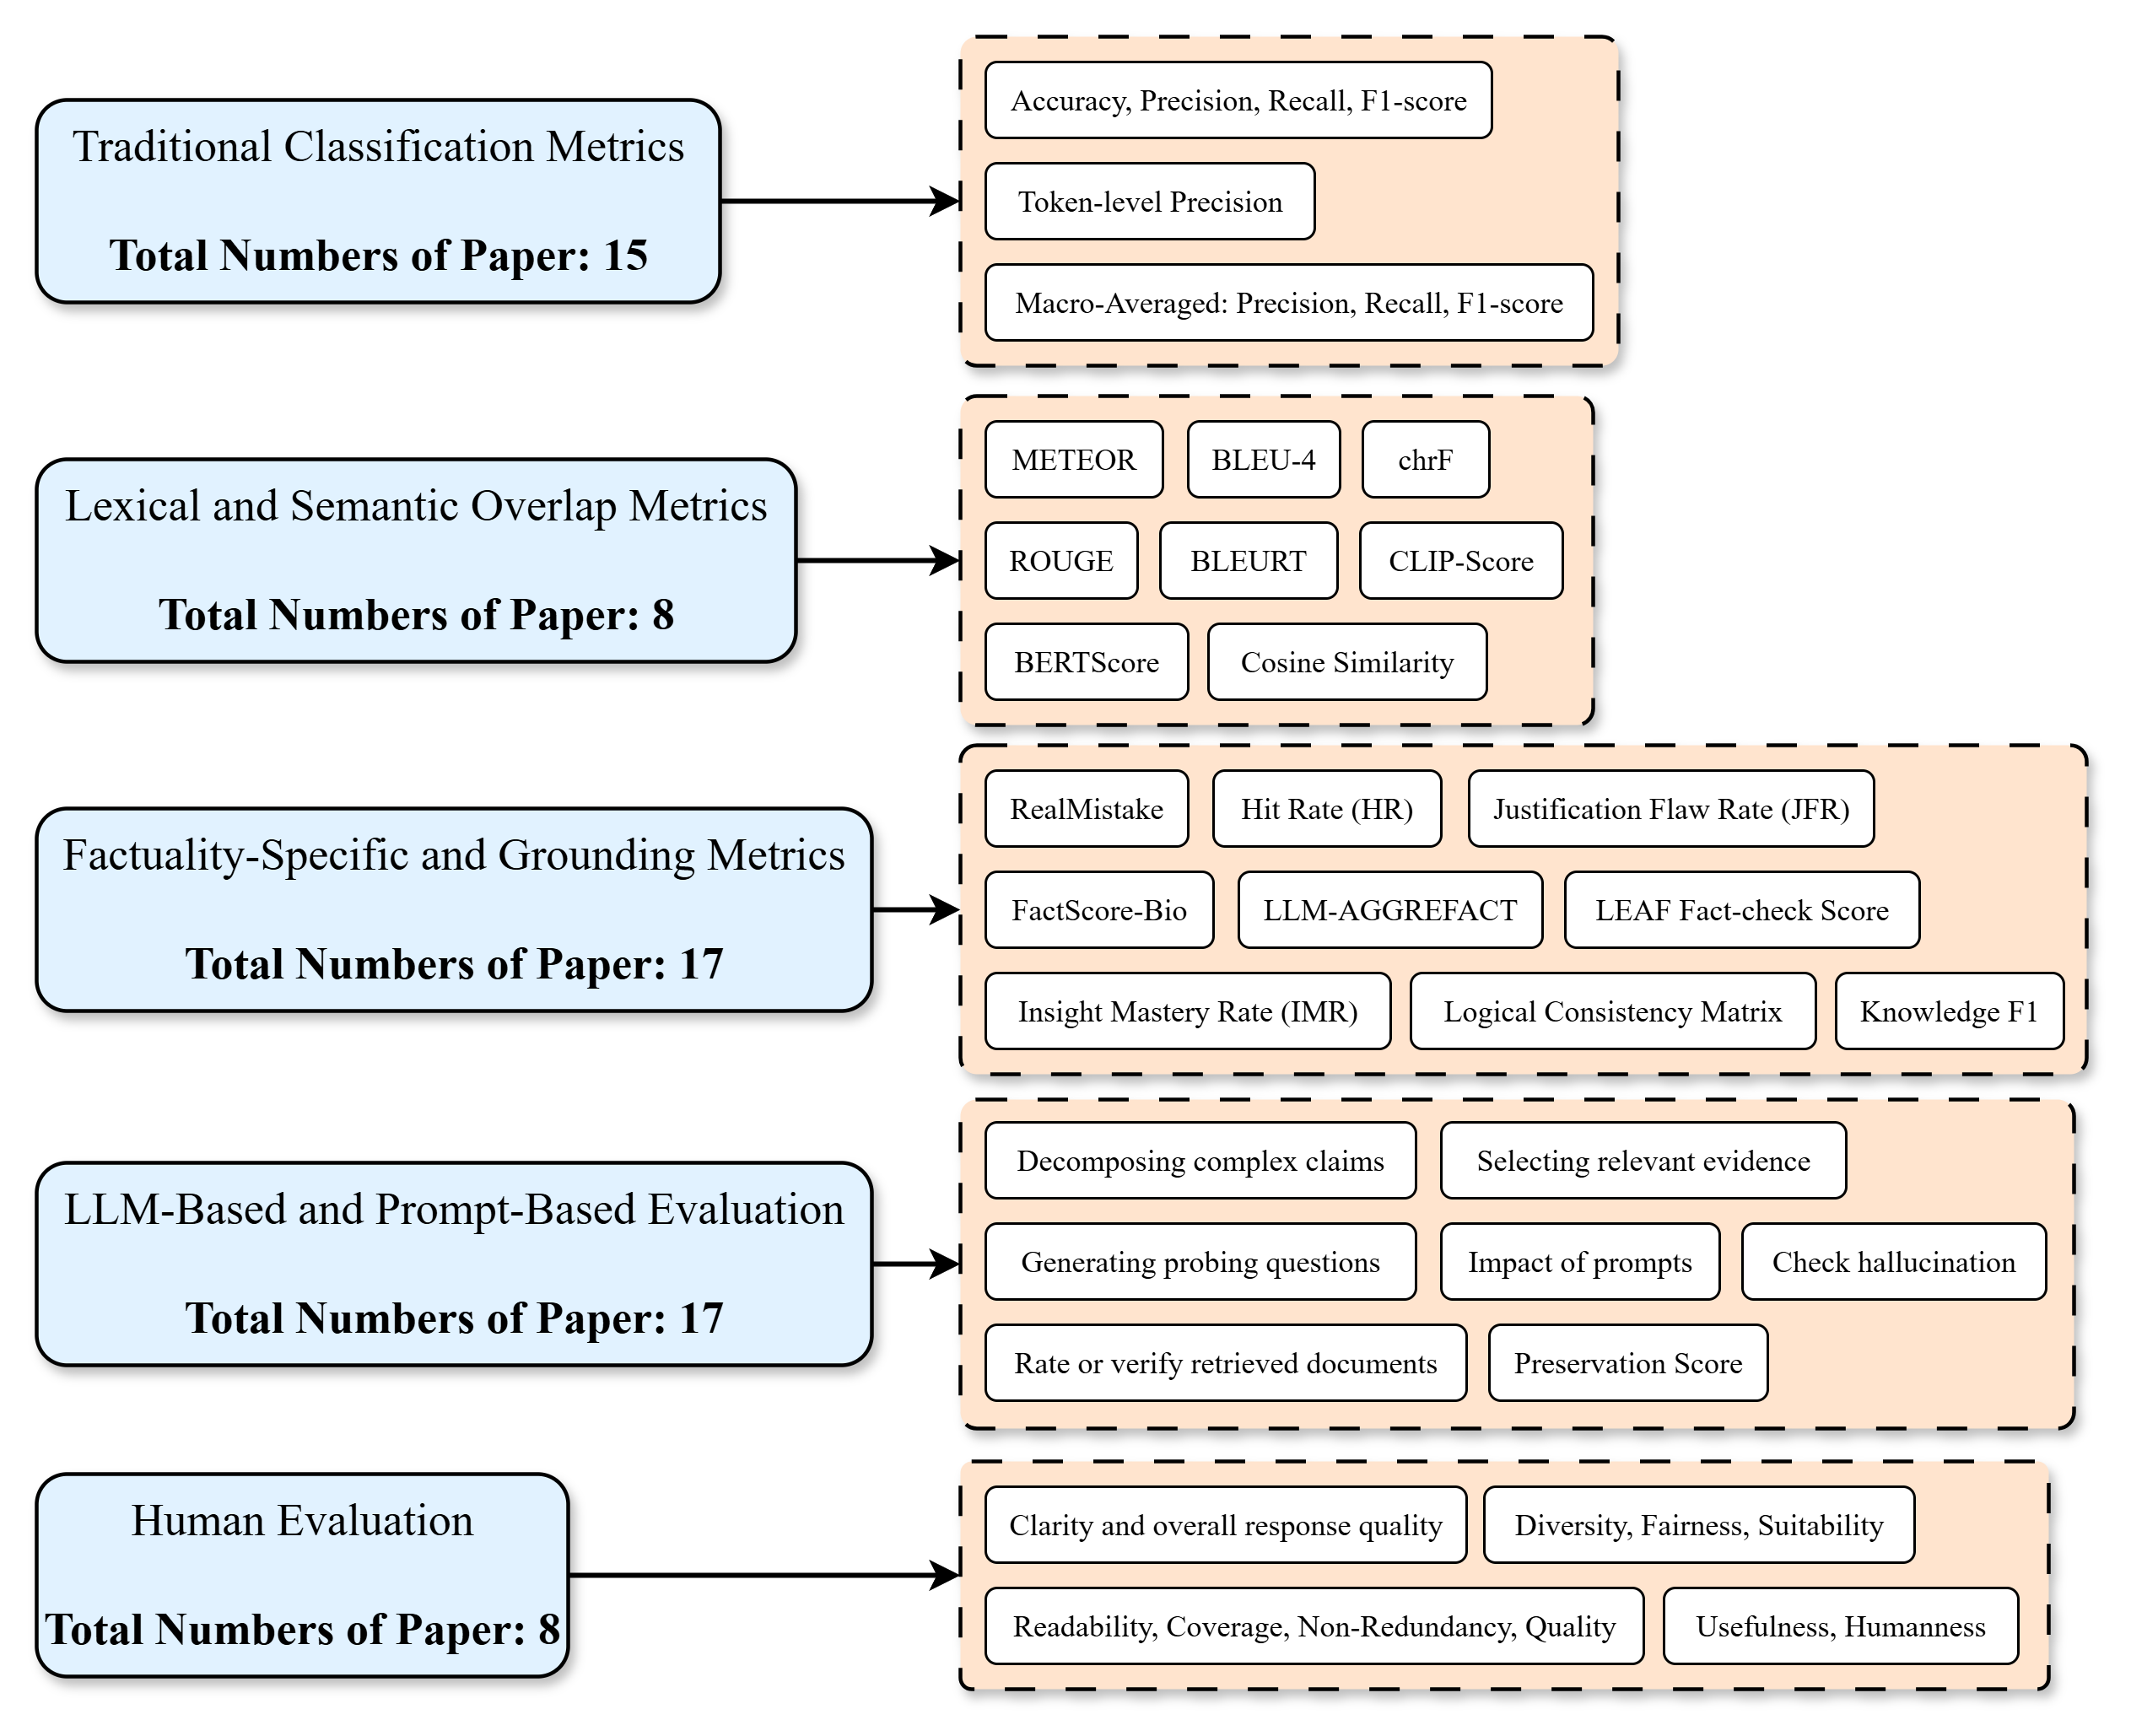
The image is a diagram categorizing different types of metrics used in evaluating language models and related tasks. It shows five main categories, each associated with a number indicating the total number of papers using metrics from that category. Each category then branches out to list specific metrics or evaluation approaches.
### Components/Axes
The diagram consists of five main categories, each represented by a light blue rounded rectangle, and associated metrics, represented by light orange rounded rectangles. Arrows connect each category to its associated metrics.
**Categories (Light Blue Rounded Rectangles):**
1. Traditional Classification Metrics
2. Lexical and Semantic Overlap Metrics
3. Factuality-Specific and Grounding Metrics
4. LLM-Based and Prompt-Based Evaluation
5. Human Evaluation
**Metrics (Light Orange Rounded Rectangles):**
* **Traditional Classification Metrics:**
* Accuracy, Precision, Recall, F1-score
* Token-level Precision
* Macro-Averaged: Precision, Recall, F1-score
* **Lexical and Semantic Overlap Metrics:**
* METEOR
* BLEU-4
* chrF
* ROUGE
* BLEURT
* CLIP-Score
* BERTScore
* Cosine Similarity
* **Factuality-Specific and Grounding Metrics:**
* RealMistake
* Hit Rate (HR)
* Justification Flaw Rate (JFR)
* FactScore-Bio
* LLM-AGGREFACT
* LEAF Fact-check Score
* Insight Mastery Rate (IMR)
* Logical Consistency Matrix
* Knowledge F1
* **LLM-Based and Prompt-Based Evaluation:**
* Decomposing complex claims
* Selecting relevant evidence
* Generating probing questions
* Impact of prompts
* Check hallucination
* Rate or verify retrieved documents
* Preservation Score
* **Human Evaluation:**
* Clarity and overall response quality
* Diversity, Fairness, Suitability
* Readability, Coverage, Non-Redundancy, Quality
* Usefulness, Humanness
**Numerical Data:**
* Traditional Classification Metrics: Total Numbers of Paper: 15
* Lexical and Semantic Overlap Metrics: Total Numbers of Paper: 8
* Factuality-Specific and Grounding Metrics: Total Numbers of Paper: 17
* LLM-Based and Prompt-Based Evaluation: Total Numbers of Paper: 17
* Human Evaluation: Total Numbers of Paper: 8
### Detailed Analysis or ### Content Details
The diagram visually represents a categorization of evaluation metrics used in the context of language models. Each category is linked to specific metrics or evaluation approaches. The number of papers associated with each category provides a sense of the prevalence of each type of metric in research.
### Key Observations
* Factuality-Specific and Grounding Metrics and LLM-Based and Prompt-Based Evaluation are the most prevalent categories, each with 17 papers.
* Lexical and Semantic Overlap Metrics and Human Evaluation are the least prevalent categories, each with 8 papers.
* Traditional Classification Metrics are moderately prevalent, with 15 papers.
### Interpretation
The diagram highlights the diverse range of metrics used to evaluate language models. The prevalence of Factuality-Specific and Grounding Metrics and LLM-Based and Prompt-Based Evaluation suggests a growing focus on evaluating the factual accuracy and reasoning abilities of language models, as well as the impact of prompts on their performance. The lower prevalence of Lexical and Semantic Overlap Metrics and Human Evaluation may indicate a shift towards more sophisticated evaluation methods that go beyond simple text similarity and subjective human judgments. The diagram provides a useful overview of the landscape of evaluation metrics and can inform the selection of appropriate metrics for specific research questions.