\n
## Diagram: Evaluation Metrics for Language Models
### Overview
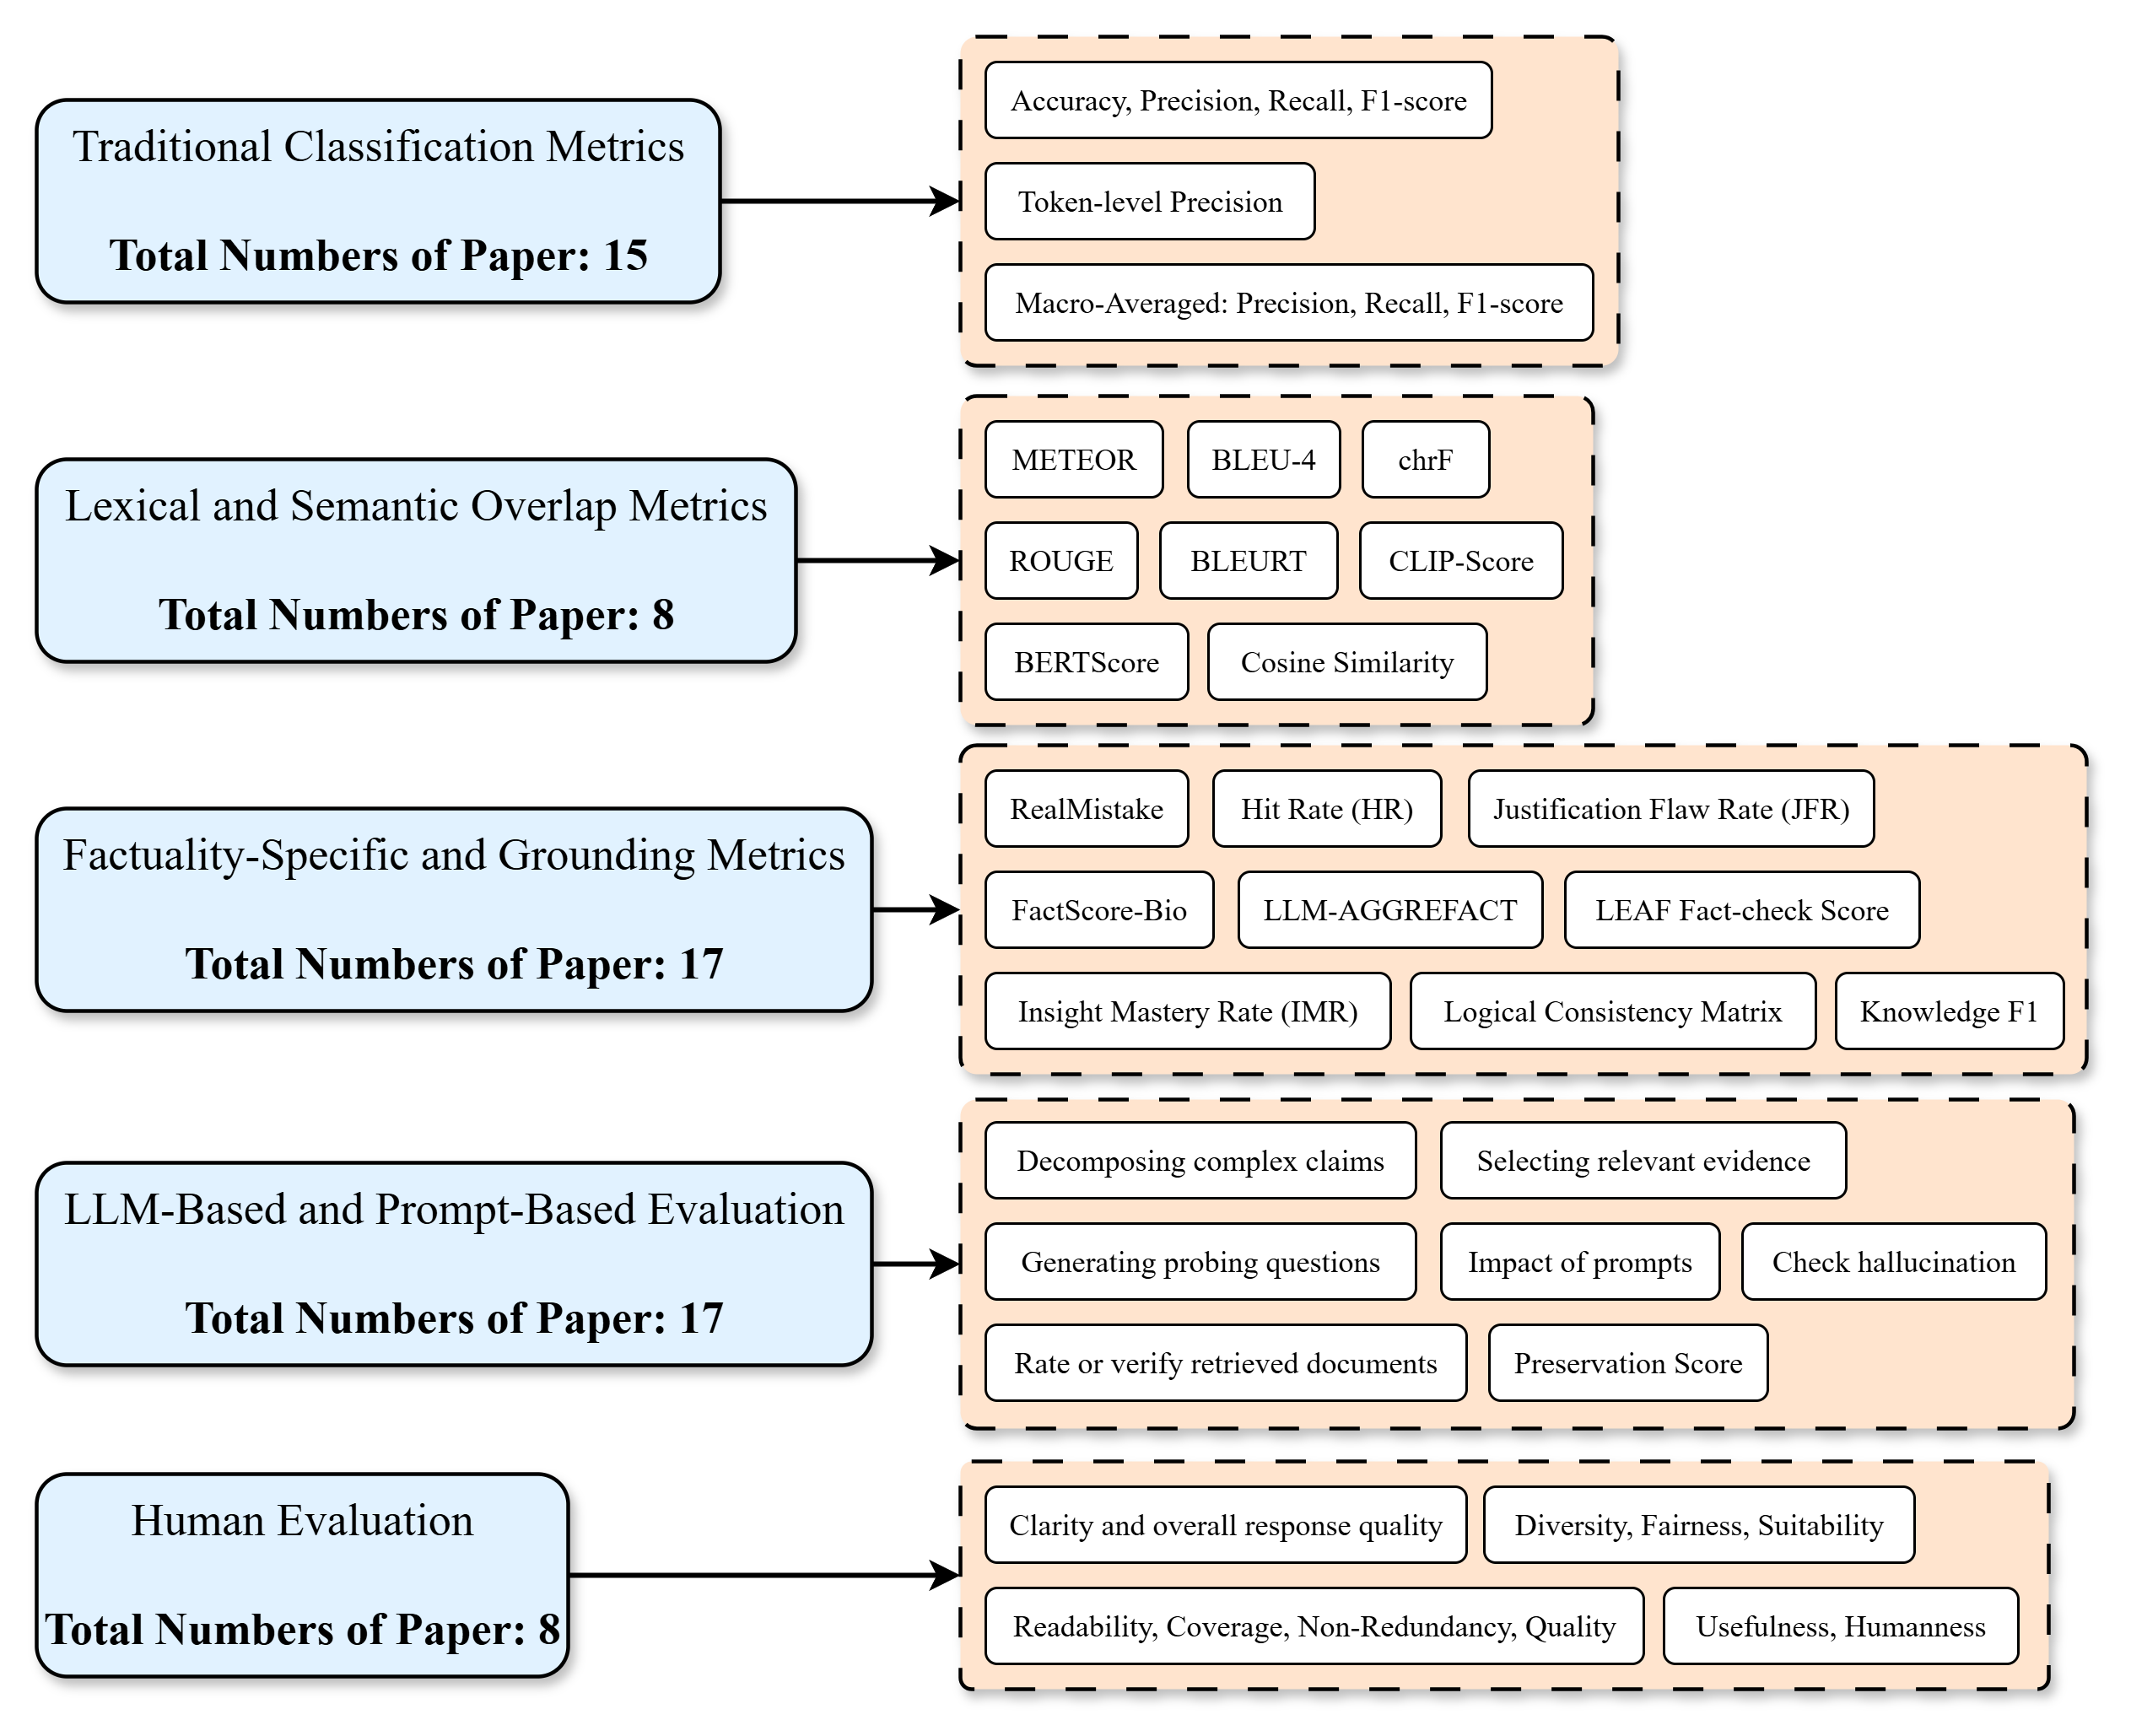
This diagram illustrates a hierarchical categorization of evaluation metrics used for assessing language models. The diagram is structured as a flow chart, with five main categories of metrics listed vertically, and sub-categories branching out to the right. Each category also includes a "Total Numbers of Paper" count. The diagram uses boxes and arrows to represent the relationships between the main categories and their respective metrics.
### Components/Axes
The diagram consists of five main categories:
1. Traditional Classification Metrics
2. Lexical and Semantic Overlap Metrics
3. Factuality-Specific and Grounding Metrics
4. LLM-Based and Prompt-Based Evaluation
5. Human Evaluation
Each category has a corresponding "Total Numbers of Paper" value. The sub-categories are listed within rectangular boxes connected to the main categories by arrows.
### Detailed Analysis or Content Details
**1. Traditional Classification Metrics:**
* Total Numbers of Paper: 15
* Sub-metrics:
* Accuracy, Precision, Recall, F1-score
* Token-level Precision
* Macro-Averaged: Precision, Recall, F1-score
**2. Lexical and Semantic Overlap Metrics:**
* Total Numbers of Paper: 8
* Sub-metrics:
* METEOR
* BLEU-4
* chrF
* ROUGE
* BLEURT
* CLIP-Score
* BERTScore
* Cosine Similarity
**3. Factuality-Specific and Grounding Metrics:**
* Total Numbers of Paper: 17
* Sub-metrics:
* RealMistake
* Hit Rate (HR)
* Justification Flaw Rate (JFR)
* FactScore-Bio
* LLM-AGGREFAT
* LEAF Fact-check Score
* Insight Mastery Rate (IMR)
* Logical Consistency Matrix
* Knowledge F1
**4. LLM-Based and Prompt-Based Evaluation:**
* Total Numbers of Paper: 17
* Sub-metrics:
* Decomposing complex claims
* Selecting relevant evidence
* Generating probing questions
* Impact of prompts
* Check hallucination
* Rate or verify retrieved documents
* Preservation Score
**5. Human Evaluation:**
* Total Numbers of Paper: 8
* Sub-metrics:
* Clarity and overall response quality
* Diversity, Fairness, Suitability
* Readability, Coverage, Non-Redundancy, Quality
* Usefulness, Humanness
The arrows indicate a flow from the main category to its associated sub-metrics. The diagram is arranged vertically, with "Traditional Classification Metrics" at the top and "Human Evaluation" at the bottom.
### Key Observations
The number of papers utilizing each category of metrics varies significantly. "Factuality-Specific and Grounding Metrics" and "LLM-Based and Prompt-Based Evaluation" have the highest number of associated papers (17 each), while "Lexical and Semantic Overlap Metrics" and "Human Evaluation" have the lowest (8 each). This suggests a growing focus on factuality and the use of LLMs themselves in evaluation.
### Interpretation
This diagram provides a structured overview of the landscape of evaluation metrics for language models. It highlights the evolution of evaluation approaches, starting with traditional classification metrics and progressing towards more sophisticated methods that consider factuality, LLM-based evaluation, and human judgment. The "Total Numbers of Paper" values indicate the relative popularity and research activity within each category. The diagram suggests a shift in focus towards evaluating the trustworthiness and reliability of LLM outputs, as evidenced by the prominence of factuality-specific metrics and LLM-based evaluation techniques. The inclusion of human evaluation underscores the importance of subjective assessment in capturing nuanced aspects of language model performance. The diagram is a useful resource for researchers and practitioners seeking to understand the various methods available for evaluating language models and the current trends in this field.