## [Diagram]: Taxonomy of Evaluation Metrics in Research Papers
### Overview
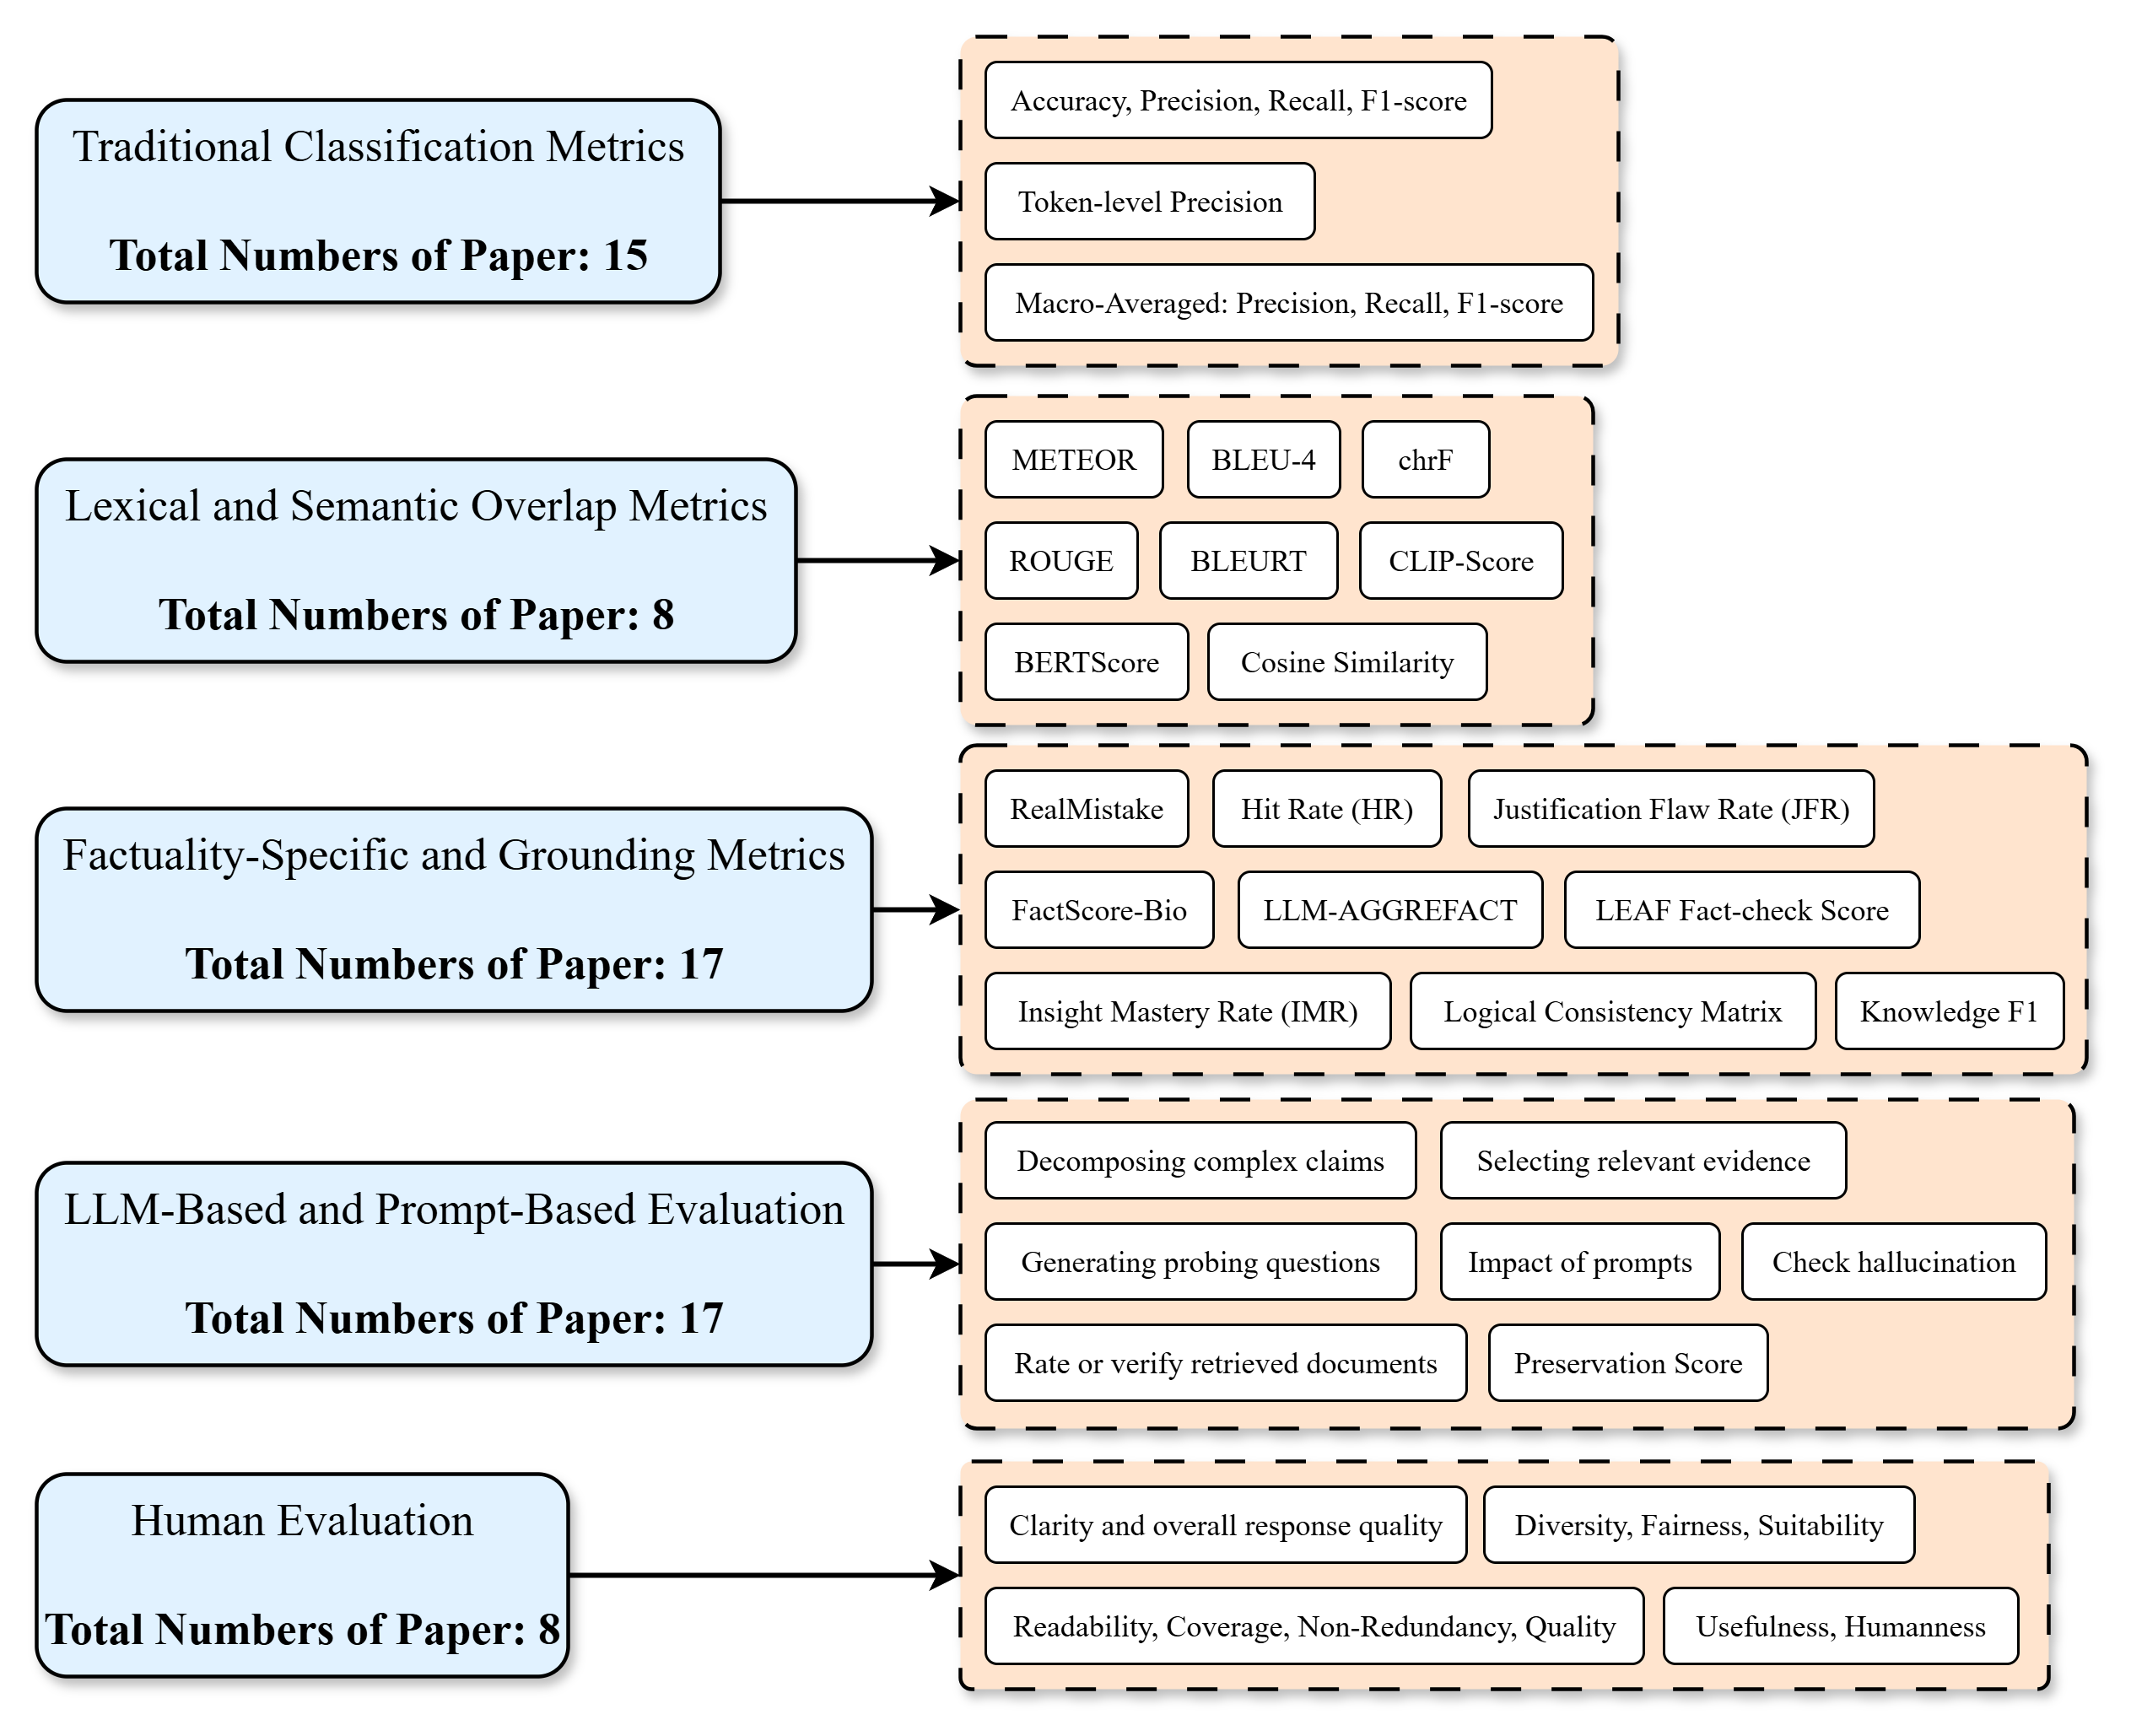
The image is a flowchart-style diagram that categorizes evaluation metrics used in research papers into five distinct groups. Each group is represented by a light blue rounded rectangle on the left, which contains the category name and the total number of papers associated with it. An arrow points from each category to a corresponding light orange dashed-border box on the right, which lists the specific metrics or evaluation methods within that category. The metrics are presented in individual white rounded rectangles.
### Components/Axes
The diagram is structured vertically with five main rows. Each row consists of:
1. **Left Component (Category):** A light blue rounded rectangle containing:
* The category name (e.g., "Traditional Classification Metrics").
* The text "Total Numbers of Paper: [Number]" in bold.
2. **Connector:** A black arrow pointing from the left component to the right component.
3. **Right Component (Metrics Group):** A light orange box with a dashed border containing multiple white rounded rectangles, each listing a specific metric or method.
### Detailed Analysis
The diagram details the following five categories and their associated metrics:
**1. Traditional Classification Metrics**
* **Total Papers:** 15
* **Associated Metrics:**
* Accuracy, Precision, Recall, F1-score
* Token-level Precision
* Macro-Averaged: Precision, Recall, F1-score
**2. Lexical and Semantic Overlap Metrics**
* **Total Papers:** 8
* **Associated Metrics:**
* METEOR
* BLEU-4
* chrF
* ROUGE
* BLEURT
* CLIP-Score
* BERTScore
* Cosine Similarity
**3. Factuality-Specific and Grounding Metrics**
* **Total Papers:** 17
* **Associated Metrics:**
* RealMistake
* Hit Rate (HR)
* Justification Flaw Rate (JFR)
* FactScore-Bio
* LLM-AGGREFACT
* LEAF Fact-check Score
* Insight Mastery Rate (IMR)
* Logical Consistency Matrix
* Knowledge F1
**4. LLM-Based and Prompt-Based Evaluation**
* **Total Papers:** 17
* **Associated Methods/Tasks:**
* Decomposing complex claims
* Selecting relevant evidence
* Generating probing questions
* Impact of prompts
* Check hallucination
* Rate or verify retrieved documents
* Preservation Score
**5. Human Evaluation**
* **Total Papers:** 8
* **Associated Criteria:**
* Clarity and overall response quality
* Diversity, Fairness, Suitability
* Readability, Coverage, Non-Redundancy, Quality
* Usefulness, Humanness
### Key Observations
* **Paper Distribution:** The categories "Factuality-Specific and Grounding Metrics" and "LLM-Based and Prompt-Based Evaluation" are the most prevalent, each associated with 17 papers. "Traditional Classification Metrics" follows with 15 papers. "Lexical and Semantic Overlap Metrics" and "Human Evaluation" are the least common in this sample, each with 8 papers.
* **Metric Specificity:** The diagram moves from general, well-established metrics (e.g., Accuracy, F1-score, BLEU) in the top categories to more specialized, novel, or task-specific metrics and evaluation paradigms (e.g., FactScore-Bio, LLM-AGGREFACT, Preservation Score) in the lower categories.
* **Evaluation Paradigm Shift:** The inclusion of "LLM-Based and Prompt-Based Evaluation" as a major category highlights a significant trend towards using Large Language Models themselves as evaluators or designing prompts for automated assessment.
### Interpretation
This diagram serves as a **taxonomy or survey map** of evaluation methodologies within a specific research domain, likely Natural Language Processing (NLP) or AI system assessment. It visually organizes the landscape of how researchers measure performance.
* **What it demonstrates:** The data suggests a research field that is evolving beyond traditional, automated metrics (like BLEU or Accuracy) towards more nuanced evaluations. There is a strong emphasis on **factual correctness** (Factuality-Specific metrics) and leveraging **LLMs for evaluation** (LLM-Based methods), indicating these are critical and active areas of investigation. The equal high paper count for these two categories suggests they are complementary frontiers.
* **Relationships:** The categories are not mutually exclusive but represent different philosophical approaches: intrinsic metric calculation (top two), specialized quality assessment (middle), meta-evaluation using AI (fourth), and subjective human judgment (bottom). The flow from top to bottom can be seen as a progression from objective, automated scoring towards more complex, context-aware, and human-aligned evaluation.
* **Notable Patterns:** The relatively lower count for "Human Evaluation" papers might reflect its cost and scalability challenges, pushing the field to develop the automated alternatives shown in the other categories. The detailed breakdown within "Factuality-Specific" metrics shows a rich ecosystem of tools designed to combat hallucinations and ensure grounding, which is a core challenge for modern AI systems.