## Line Chart: Per-Period Regret vs. Time Period for Different Agents
### Overview
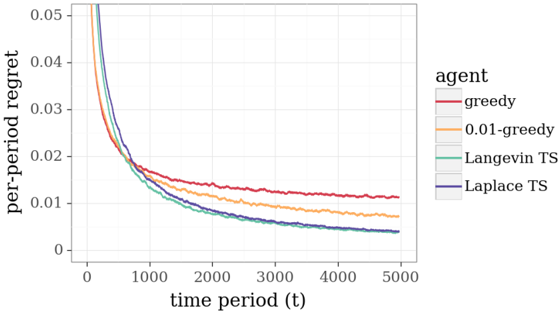
The image is a line chart comparing the per-period regret of four different agents (greedy, 0.01-greedy, Langevin TS, and Laplace TS) over time. The x-axis represents the time period, and the y-axis represents the per-period regret. The chart shows how the regret changes for each agent as the time period increases.
### Components/Axes
* **Title:** There is no explicit title on the chart.
* **X-axis:**
* Label: "time period (t)"
* Scale: 0 to 5000, with markers at 0, 1000, 2000, 3000, 4000, and 5000.
* **Y-axis:**
* Label: "per-period regret"
* Scale: 0 to 0.05, with markers at 0, 0.01, 0.02, 0.03, 0.04, and 0.05.
* **Legend:** Located on the right side of the chart.
* greedy (red line)
* 0.01-greedy (orange line)
* Langevin TS (green line)
* Laplace TS (blue line)
### Detailed Analysis
* **Greedy (Red):** The per-period regret starts high (approximately 0.05) and decreases rapidly initially. It then plateaus around 0.013 after approximately 2000 time periods, with some fluctuations.
* At time period 0: ~0.05
* At time period 1000: ~0.018
* At time period 5000: ~0.013
* **0.01-greedy (Orange):** Similar to the greedy agent, the regret starts high (approximately 0.05) and decreases rapidly. It plateaus around 0.011 after approximately 2000 time periods, with some fluctuations.
* At time period 0: ~0.05
* At time period 1000: ~0.014
* At time period 5000: ~0.011
* **Langevin TS (Green):** The regret starts high (approximately 0.05) and decreases rapidly. It plateaus around 0.005 after approximately 2000 time periods, with some fluctuations.
* At time period 0: ~0.05
* At time period 1000: ~0.009
* At time period 5000: ~0.005
* **Laplace TS (Blue):** The regret starts high (approximately 0.05) and decreases rapidly. It plateaus around 0.005 after approximately 2000 time periods, with some fluctuations.
* At time period 0: ~0.05
* At time period 1000: ~0.008
* At time period 5000: ~0.004
### Key Observations
* All agents exhibit a rapid decrease in per-period regret during the initial time periods.
* The regret plateaus for all agents after approximately 2000 time periods.
* The Langevin TS and Laplace TS agents achieve significantly lower regret compared to the greedy and 0.01-greedy agents.
* The greedy agent has the highest final regret, followed by the 0.01-greedy agent.
### Interpretation
The chart demonstrates the performance of different reinforcement learning agents in terms of per-period regret over time. The Thompson Sampling (TS) based agents (Langevin TS and Laplace TS) outperform the greedy and 0.01-greedy agents, indicating that exploration strategies like Thompson Sampling can lead to better long-term performance. The initial rapid decrease in regret suggests that all agents quickly learn to avoid the worst actions, while the plateau indicates a convergence towards a stable policy. The difference in plateau levels highlights the effectiveness of different exploration strategies in minimizing regret.