## Diagram: Neural Network Architectures
### Overview
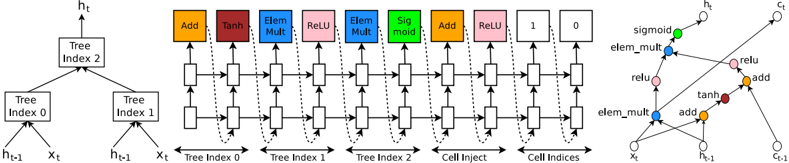
The image presents three diagrams illustrating different neural network architectures or components. The first diagram shows a tree-like structure, the second depicts a recurrent neural network (RNN) cell with various operations, and the third shows a graph-like representation of operations within a cell.
### Components/Axes
**Diagram 1: Tree Structure**
* **Nodes:** Labeled "Tree Index 0", "Tree Index 1", and "Tree Index 2". These are rectangular boxes.
* **Inputs:** Labeled "h<sub>t-1</sub>" and "x<sub>t</sub>" at the bottom, feeding into "Tree Index 0" and "Tree Index 1".
* **Output:** Labeled "h<sub>t</sub>" at the top, originating from "Tree Index 2".
* **Connections:** Arrows indicate the flow of information from inputs to tree nodes and from lower-level tree nodes to higher-level ones.
**Diagram 2: Recurrent Neural Network (RNN) Cell**
* **Horizontal Flow:** A series of interconnected rectangular boxes, representing the flow of information through time steps.
* **Vertical Operations:** Above each rectangular box in the top row are colored squares representing operations:
* Orange: "Add"
* Dark Red: "Tanh"
* Blue: "Elem Mult" (Element-wise Multiplication)
* Pink: "ReLU" (Rectified Linear Unit)
* Green: "Sigmoid"
* White: "1" and "0"
* **Recurrent Connections:** Dashed lines with arrows indicate feedback loops, connecting the output of certain operations back to earlier stages.
* **Input Labels:** "x<sub>t</sub>" below the first set of boxes.
* **Sections:** Labeled "Tree Index 0", "Tree Index 1", "Tree Index 2", "Cell Inject", and "Cell Indices" to indicate different parts of the RNN cell.
**Diagram 3: Graph Representation**
* **Nodes:** Circles representing operations, colored according to the same scheme as in Diagram 2:
* Orange: "add"
* Dark Red: "tanh"
* Blue: "elem_mult"
* Pink: "relu"
* Green: "sigmoid"
* White: Input/Output nodes
* **Inputs:** Labeled "x<sub>t</sub>", "h<sub>t-1</sub>", and "c<sub>t-1</sub>".
* **Output:** Labeled "h<sub>t</sub>" and "c<sub>t</sub>".
* **Connections:** Arrows indicate the flow of information between operations.
### Detailed Analysis
**Diagram 1: Tree Structure**
* The diagram represents a hierarchical processing of inputs h<sub>t-1</sub> and x<sub>t</sub>.
* "Tree Index 0" processes h<sub>t-1</sub> and x<sub>t</sub>.
* "Tree Index 1" processes h<sub>t-1</sub> and x<sub>t</sub>.
* "Tree Index 2" combines the outputs of "Tree Index 0" and "Tree Index 1" to produce h<sub>t</sub>.
**Diagram 2: Recurrent Neural Network (RNN) Cell**
* The diagram illustrates the sequential processing of information in an RNN cell.
* The horizontal flow represents the progression through time steps.
* The vertical operations (Add, Tanh, Elem Mult, ReLU, Sigmoid) represent transformations applied to the data at each time step.
* The recurrent connections (dashed lines) allow the network to retain information from previous time steps.
* The "Cell Inject" and "Cell Indices" sections likely represent mechanisms for injecting external information or controlling the cell's behavior.
**Diagram 3: Graph Representation**
* The diagram shows the interconnections between different operations within a neural network cell.
* The colors of the nodes correspond to the types of operations (Add, Tanh, Elem Mult, ReLU, Sigmoid).
* The arrows indicate the flow of data between these operations.
* The graph structure highlights the complex dependencies and interactions between different components of the cell.
### Key Observations
* The diagrams represent different levels of abstraction in neural network architectures.
* Diagram 1 shows a tree-like structure, Diagram 2 shows an RNN cell with sequential processing and recurrent connections, and Diagram 3 shows a graph representation of operations within a cell.
* The use of color-coding in Diagrams 2 and 3 helps to visually distinguish different types of operations.
### Interpretation
The diagrams illustrate the complexity and diversity of neural network architectures. The tree structure in Diagram 1 may represent a hierarchical processing of data, while the RNN cell in Diagram 2 shows how information can be processed sequentially and retained over time. The graph representation in Diagram 3 highlights the intricate relationships between different operations within a cell. These diagrams are useful for understanding the underlying principles and design choices in neural networks. The consistent color-coding across diagrams helps to connect the different levels of abstraction and understand the relationships between different components.