TECHNICAL ASSET FINGERPRINT
a5059f37654d45af5928e729
Click to view fullscreen
Press ESC or click to close
FOUND IN PAPERS
EXPERT: healer-alpha-free VERSION 1
RUNTIME: free/openrouter/healer-alpha
INTEL_VERIFIED
## Diagram: Neural Network Computational Graph with Tree-Structured Inputs
### Overview
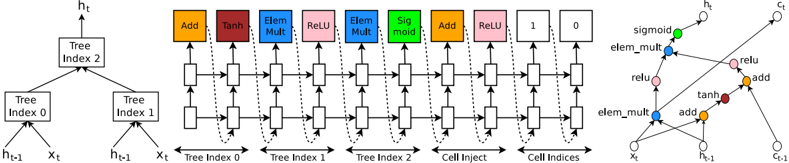
The image displays a technical diagram illustrating a computational graph or neural network architecture that processes tree-structured data. It is divided into three distinct but related sections: a hierarchical tree structure on the left, a sequential operation pipeline in the center, and a detailed directed acyclic graph (DAG) on the right. The diagram appears to describe a mechanism for aggregating information from multiple tree nodes (indexed 0, 1, 2) through a series of operations to produce a final output state.
### Components/Axes
The diagram is segmented into three primary regions:
1. **Left Section (Tree Structure):**
* A hierarchical tree with three nodes labeled **Tree Index 0**, **Tree Index 1**, and **Tree Index 2**.
* **Tree Index 2** is the parent node, with arrows pointing to it from **Tree Index 0** and **Tree Index 1**.
* Each tree node (0, 1, 2) receives two inputs: **h_{t-1}** (likely a previous hidden state) and **x_t** (likely a current input feature).
* The final output from **Tree Index 2** is labeled **h_t** (the new hidden state).
2. **Center Section (Sequential Operation Pipeline):**
* A horizontal sequence of computational blocks, each represented by a colored box with an operation name.
* The operations, in order from left to right, are:
* **Add** (Orange)
* **Tanh** (Dark Red)
* **Elem Mult** (Blue) - Element-wise Multiplication
* **ReLU** (Pink)
* **Elem Mult** (Blue)
* **Sigmoid** (Green)
* **Add** (Orange)
* **ReLU** (Pink)
* **1** (Light Gray) - Likely a constant or identity operation.
* **0** (Light Gray) - Likely a constant or zero operation.
* Below this sequence, labels indicate the source of data for the operations:
* **Tree Index 0**
* **Tree Index 1**
* **Tree Index 2**
* **Cell Inject**
* **Cell Indices**
* A network of solid and dashed arrows connects these blocks, showing the flow of data. Dashed arrows appear to represent connections from the tree indices to specific operations in the pipeline.
3. **Right Section (Directed Acyclic Graph - DAG):**
* A more detailed, graph-based representation of the computation.
* **Input Nodes (Bottom):** `x_t`, `h_{t-1}`, `c_{t-1}` (likely a previous cell state).
* **Operation Nodes (Colored Circles):**
* `add` (Orange, two instances)
* `tanh` (Dark Red)
* `elem_mult` (Blue, two instances)
* `relu` (Pink, two instances)
* `sigmoid` (Green)
* **Output Nodes (Top):** `h_t` (new hidden state), `c_t` (new cell state).
* The graph shows how inputs are combined through the operations. For example, `x_t` and `h_{t-1}` feed into an `add` node, whose output goes to a `tanh` node, and so on. The structure suggests a gating mechanism similar to those found in Long Short-Term Memory (LSTM) or Gated Recurrent Unit (GRU) cells, but adapted for tree-structured inputs.
### Detailed Analysis
* **Data Flow:** The diagram illustrates a two-stage process. First (left), information from child nodes (Tree Index 0 & 1) is aggregated into a parent node (Tree Index 2). Second (center & right), this aggregated tree information, along with a potential cell state (`c_{t-1}`) and an injection signal (`Cell Inject`), is processed through a complex sequence of linear (`Add`), non-linear (`Tanh`, `ReLU`, `Sigmoid`), and multiplicative (`Elem Mult`) operations.
* **Operation Sequence:** The center pipeline's order is critical. It begins with an `Add` and `Tanh`, suggesting initial transformation. The subsequent `Elem Mult` and `ReLU` blocks, followed by another `Elem Mult` and a `Sigmoid`, are characteristic of gating mechanisms (e.g., input, forget, and output gates in LSTMs) that control information flow. The final `Add` and `ReLU` likely produce the new hidden state `h_t`.
* **Graph Correspondence:** The right-side DAG is a direct mapping of the center pipeline. Each colored operation box corresponds to a colored circle node. The DAG explicitly shows the connectivity, revealing that the `sigmoid` output gates one of the `elem_mult` operations, and the final `h_t` is the output of a `relu` node.
### Key Observations
1. **Hybrid Architecture:** The diagram combines a tree-based hierarchical structure with a recurrent neural network (RNN) cell-like computational graph. This suggests a model designed for tasks involving both sequential data and hierarchical relationships, such as code analysis, document parsing, or reasoning over structured data.
2. **Gating Mechanism:** The presence of `Sigmoid` activations feeding into `Elem Mult` operations is a strong visual indicator of gating, used to selectively update or pass information.
3. **Multiple Inputs:** The cell processes inputs from three distinct sources: the tree structure (`Tree Index 0,1,2`), a recurrent state (`h_{t-1}, c_{t-1}`), and an external injection (`Cell Inject`).
4. **Constant Operations:** The blocks labeled **1** and **0** at the end of the center pipeline are unusual. They may represent fixed outputs, bias terms, or a mechanism to reset or pass through values unchanged under certain conditions.
### Interpretation
This diagram likely represents the architecture of a **Tree-Structured Gated Recurrent Unit** or a similar neural network cell designed for recursive or hierarchical data. The core innovation appears to be the integration of a tree aggregation mechanism (left) with a sophisticated, gated recurrent unit (center/right).
* **Purpose:** The model is built to process data with inherent tree-like structure (e.g., abstract syntax trees in programming languages, parse trees in NLP, or organizational charts) while maintaining a memory of past sequences via the recurrent connections (`h_{t-1}`, `c_{t-1}`).
* **Mechanism:** The tree indices suggest the cell can attend to or aggregate features from different nodes in a tree. The gated operations then dynamically combine this tree-based context with the previous recurrent state to compute an updated representation (`h_t`, `c_t`). The `Cell Inject` input provides a pathway for external information to directly influence the cell's state.
* **Significance:** Such an architecture would be valuable for tasks requiring understanding of both structure and sequence, like generating code from natural language, analyzing scientific formulas, or reasoning over knowledge graphs. The diagram meticulously details the exact operations and data flows, serving as a blueprint for implementing this specific neural network component.
DECODING INTELLIGENCE...