## Diagram: Neural Network Architecture with Hierarchical Tree Indices
### Overview
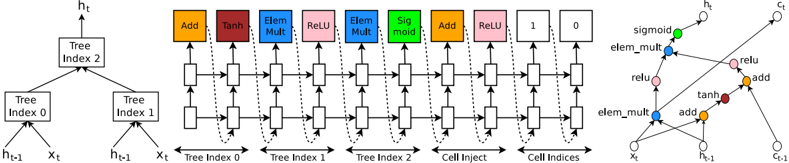
The image depicts a technical diagram of a neural network architecture with hierarchical tree indices and element-wise operations. It combines a tree-based structure on the left, a sequence of operations in the middle, and a graph representation of data flow on the right. The diagram uses color-coded blocks and arrows to illustrate computational steps and data dependencies.
### Components/Axes
1. **Left Section (Tree Indices)**:
- **Tree Index 2**: Root node splitting into two branches.
- **Tree Index 0** and **Tree Index 1**: Child nodes of Tree Index 2.
- Inputs: `h_{t-1}` (previous hidden state) and `x_t` (current input).
- Outputs: `h_t` (current hidden state).
2. **Middle Section (Operations)**:
- **Operations**:
- **Add** (orange), **Tanh** (red), **Elem Mult** (blue), **ReLU** (pink), **Sigmoid** (green).
- **Flow**:
- Data flows from Tree Index 0 and 1 through sequential operations (e.g., Add → Tanh → Elem Mult → ReLU → Sigmoid).
- **Cell Inject**: Final operation before output.
3. **Right Section (Graph Representation)**:
- **Nodes**: Represent operations (e.g., `sigmoid`, `elem_mult`, `relu`, `tanh`, `add`).
- **Edges**: Arrows indicate data flow between operations.
- **Inputs/Outputs**:
- Inputs: `x_t`, `h_{t-1}`.
- Outputs: `h_t`, `c_t` (cell state).
4. **Legend**:
- **Colors**:
- Orange = Add, Red = Tanh, Blue = Elem Mult, Pink = ReLU, Green = Sigmoid.
- **Placement**: Located on the far right, aligned with the graph.
### Detailed Analysis
- **Tree Index Hierarchy**:
- Tree Index 2 splits into Tree Index 0 and 1, suggesting parallel processing paths.
- Each tree index processes `h_{t-1}` and `x_t` to produce intermediate states.
- **Operation Sequence**:
- **Tree Index 0**:
- `h_{t-1}` and `x_t` are added, passed through Tanh, then element-wise multiplied with another input.
- Result is activated via ReLU.
- **Tree Index 1**:
- Similar operations but with different input combinations (e.g., `h_{t-1}` and `x_t` added, then Tanh applied).
- **Cell Inject**: Combines outputs from Tree Index 0 and 1, followed by a final ReLU activation.
- **Graph Representation**:
- Nodes are labeled with operations (e.g., `sigmoid`, `elem_mult`).
- Arrows show dependencies: e.g., `x_t` feeds into `elem_mult`, which connects to `relu`.
### Key Observations
1. **Hierarchical Structure**: The tree indices enable parallel computation paths, likely for feature extraction or attention mechanisms.
2. **Operation Flow**:
- Non-linear transformations (Tanh, ReLU, Sigmoid) are interspersed with linear operations (Add, Elem Mult).
- Element-wise multiplication (`elem_mult`) suggests gating mechanisms (e.g., GRU/LSTM-like).
3. **Outputs**:
- `h_t` (hidden state) and `c_t` (cell state) indicate a recurrent or stateful architecture.
4. **Legend Consistency**: Colors in the graph match the legend (e.g., pink nodes correspond to ReLU operations).
### Interpretation
This diagram represents a **recurrent neural network (RNN)** or **transformer-like architecture** with hierarchical processing. The tree indices allow the model to capture multi-scale dependencies in the input data (`x_t`), while the sequence of operations (Add, Tanh, Elem Mult, ReLU, Sigmoid) introduces non-linearity and gating for robust feature learning. The graph on the right visualizes how data propagates through the network, emphasizing the role of element-wise operations in modulating information flow. The use of `c_t` (cell state) suggests memory retention, akin to LSTM/GRU cells, enabling the model to handle sequential data effectively. The hierarchical tree structure may improve interpretability or efficiency by organizing computations into modular sub-networks.