## Chart: Llama-3.1-8B Proportion of Flips vs. Iterations
### Overview
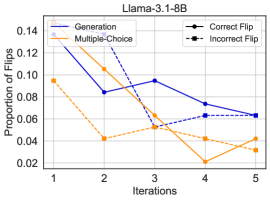
The image is a line chart comparing the proportion of flips across iterations for two methods: Generation and Multiple-Choice. It also shows the proportion of correct and incorrect flips. The x-axis represents iterations (1 to 5), and the y-axis represents the proportion of flips.
### Components/Axes
* **Title:** Llama-3.1-8B
* **X-axis:** Iterations (1, 2, 3, 4, 5)
* **Y-axis:** Proportion of Flips (0.02, 0.04, 0.06, 0.08, 0.10, 0.12, 0.14)
* **Legend (Top-Left):**
* Generation (Solid Navy Blue Line)
* Multiple-Choice (Solid Orange Line)
* **Legend (Top-Right):**
* Correct Flip (Solid Black Line with Circle Markers)
* Incorrect Flip (Dashed Black Line with Circle Markers)
### Detailed Analysis
* **Generation (Solid Navy Blue Line):**
* Trend: Decreasing overall.
* Data Points:
* Iteration 1: ~0.13
* Iteration 2: ~0.085
* Iteration 3: ~0.095
* Iteration 4: ~0.072
* Iteration 5: ~0.063
* **Multiple-Choice (Solid Orange Line):**
* Trend: Decreasing then slightly increasing.
* Data Points:
* Iteration 1: ~0.095
* Iteration 2: ~0.105
* Iteration 3: ~0.053
* Iteration 4: ~0.02
* Iteration 5: ~0.042
* **Correct Flip (Solid Black Line with Circle Markers):**
* Trend: Decreasing overall.
* Data Points:
* Iteration 1: ~0.13
* Iteration 2: ~0.085
* Iteration 3: ~0.095
* Iteration 4: ~0.072
* Iteration 5: ~0.063
* **Incorrect Flip (Dashed Black Line with Circle Markers):**
* Trend: Decreasing then slightly increasing.
* Data Points:
* Iteration 1: ~0.095
* Iteration 2: ~0.042
* Iteration 3: ~0.053
* Iteration 4: ~0.063
* Iteration 5: ~0.032
### Key Observations
* The proportion of flips for the Generation method starts higher than the Multiple-Choice method but decreases more consistently over iterations.
* The proportion of flips for the Multiple-Choice method decreases sharply initially, then increases slightly in the last iteration.
* The "Correct Flip" data series is identical to the "Generation" data series.
* The "Incorrect Flip" data series is similar to the "Multiple Choice" data series.
### Interpretation
The chart compares the proportion of flips for two methods, Generation and Multiple-Choice, across five iterations. The Generation method starts with a higher proportion of flips but decreases more consistently. The Multiple-Choice method decreases sharply initially, then increases slightly in the last iteration. The data suggests that the Generation method might be more stable in reducing flips over iterations, while the Multiple-Choice method might have some variability. The "Correct Flip" and "Incorrect Flip" data series being identical to the "Generation" and "Multiple Choice" data series respectively suggests that the "Correct Flip" and "Incorrect Flip" labels are likely referring to the flips made by the Generation and Multiple-Choice methods.